A global record with one dominant market
The world installed 603,307 industrial robots in 2025, 11% more than in 2024, according to the International Federation of Robotics (IFR). China installed 354,226, up 20%, and accounted for 58.7% of the world total. These figures establish the scale and destination of annual installations. They do not identify orders waiting for delivery, equipment still being built, or the active utilization of installed robots. The buyer question is therefore narrower than whether robotics is booming: which regional installation cycle and customer industry match a planned facility, and which separate measure actually informs its supplier pipeline?[1,2]
The 58.7% figure describes China’s share of the 2025 level, rather than its share of the year-on-year increase. This report does not estimate a contribution to global net growth: the public sources publish rounded annual growth rates, and an independent matched installation series has not been established. IFR’s executive summary says installations stayed near 550,000 for four years before 2025. The new total beat the previous 2022 record of 552,946 by 9%. The regional and country panels below test how broadly that higher annual level was distributed, without turning a concentration of installations into proof of a common cause.[1,2]
Asia expanded as Europe contracted
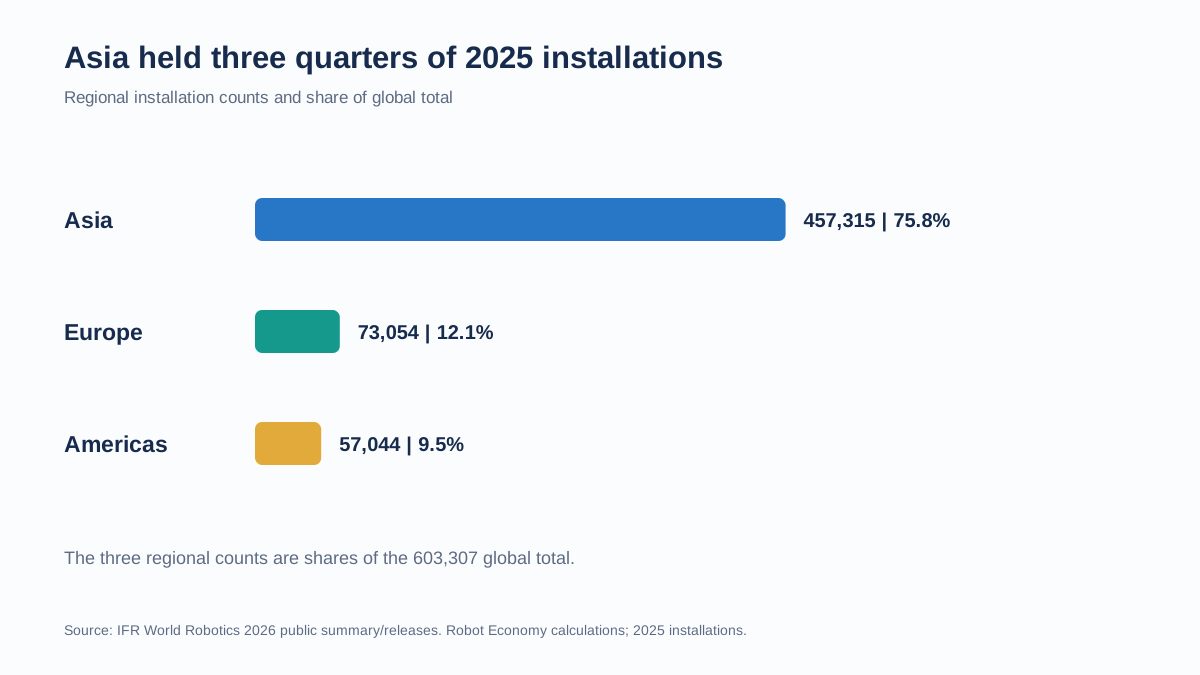
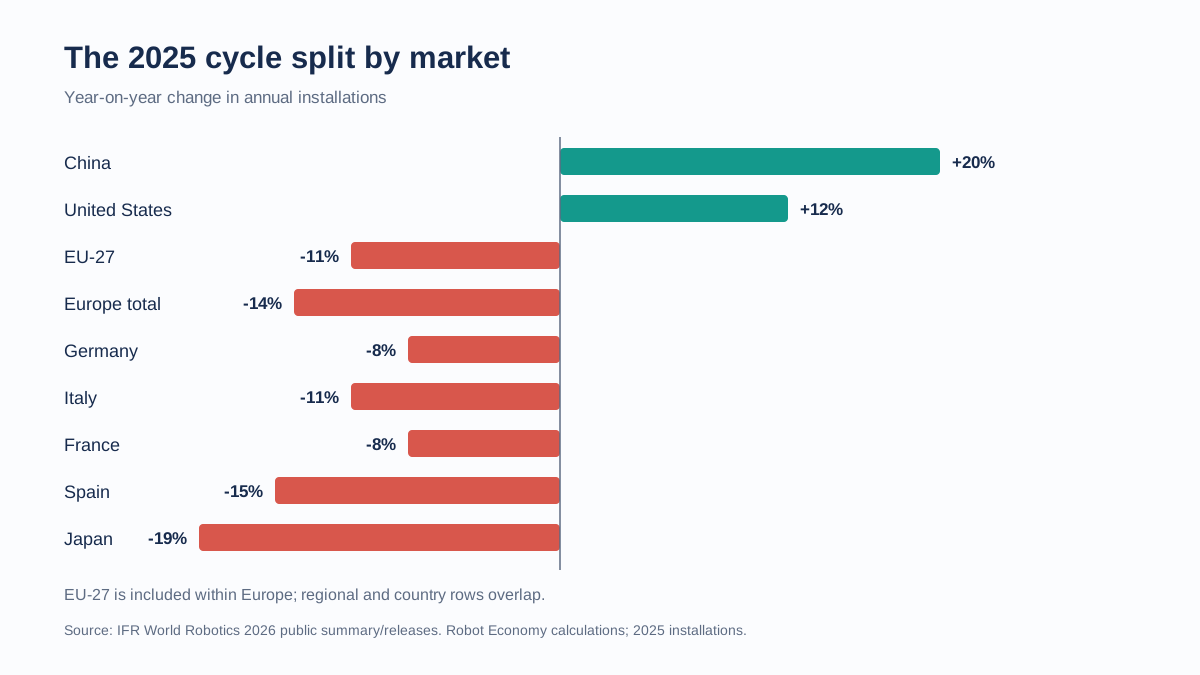
The regional panel reinforces the concentration. Asia installed 457,315 robots, up 14%, equal to 75.8% of the global total. Europe installed 73,054, down 14%, or 12.1% of the total. The Americas reached 57,044, up 14%, or 9.5%. These are regional totals, not independent country markets: China is inside Asia, and the United States is inside the Americas. The European Union figure is also a subset of Europe. The counts should not be added to national figures as if they were separate demand pools. The gap in the 2025 growth rates is more useful than a single “global boom” label: two large regions expanded at double-digit rates while Europe moved backward.[1,2,3]
The regional result is not a simple story of Asia versus everyone else. Asia’s 14% rise includes China’s 20% growth and smaller or declining markets. The Americas also grew 14%, though from a much smaller base. The European Union installed 60,500 robots, down 11%; its 2020–2025 annual growth rate was still a positive 3% compound rate. That longer window and the one-year decline describe different things. A multi-year investment trend can remain positive while a short-term installation cycle falls. Buyers should therefore test the market and time horizon relevant to their facility rather than substitute a continental headline for a local pipeline.[1,3]
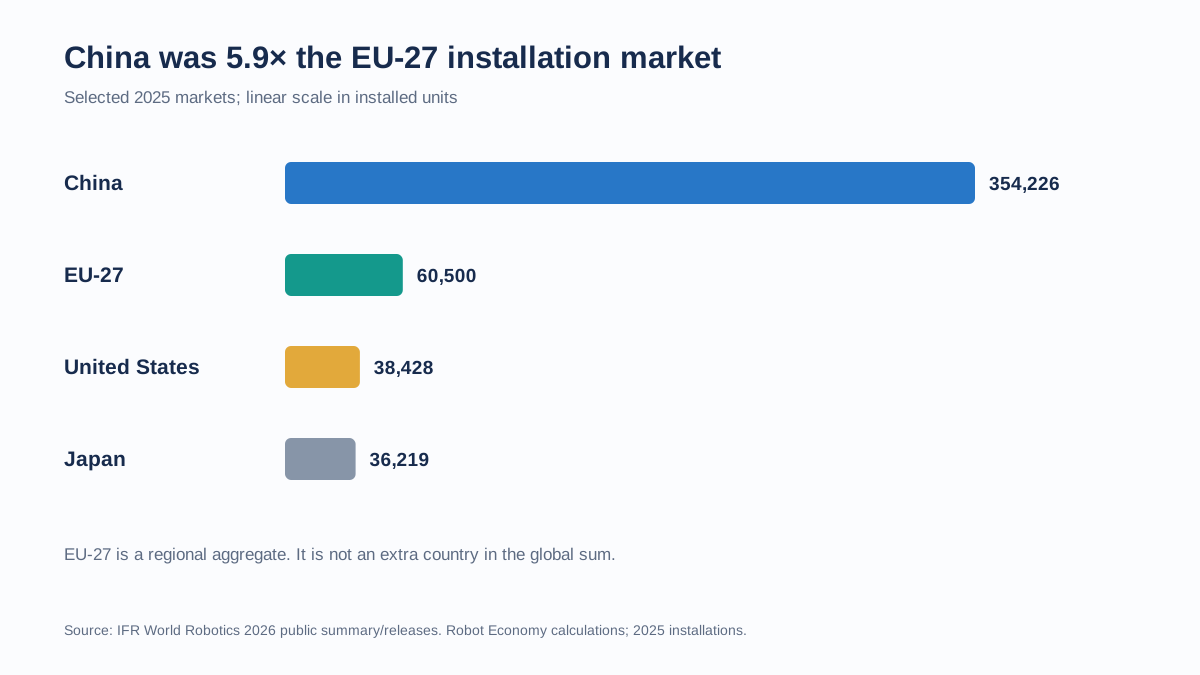
The country comparison gives the European contraction more texture. Germany remained the region’s largest market, with 24,800 installations, 41% of the EU total, but fell 8%. Italy installed about 7,800, down 11%; France about 4,500, down 8%; and Spain about 4,300, down 15%. Germany’s size did not prevent contraction, and gains in one country would not automatically describe the others. In Asia, Japan installed 36,219, down 19%. In the Americas, the United States installed 38,428, up 12%, overtaking Japan and becoming the second-largest national market after China. Its annual level was close to Japan’s even though the two moved in opposite directions.[2,3]
Production, orders and shipments are separate signals
Other primary sources show why installation data should not be blended with supply-side measures. China’s National Bureau of Statistics reported output of 773,074 industrial robots in 2025, up 28%. The series covers enterprises above the designated size, generally those with annual main-business revenue of at least 20 million yuan; the agency notes that coverage changes over time. Output measures factory production under that statistical frame. It is not a count of robots installed in Chinese factories, and the much larger unit total cannot be compared directly with IFR installations to infer a stock, import share or inventory change.[4]
A3, the Association for Advancing Automation, said companies across North America ordered 36,766 robots in 2025, worth $2.25 billion. Units were up 6.6% and revenue 10.1%. These are orders for North America, not US installations. Order timing can lead deliveries and placement, and the revenue-to-unit relationship can shift with product and customer mix. The public A3 summary gives a useful second signal that automation activity extended beyond China, but it is not a replacement denominator for IFR’s global installation measure. The summary page also gates its full supporting analysis for subscribed A3 members, so this report uses only the figures available on the public page.[5]
Japan’s Robot Association provides a third distinct view. Its survey of member and non-member companies, excluding service robots, reports 2025 total shipments of 211,139 units, up 16.4%. Domestic shipments fell 18.3% to 37,816, while exports rose 28.2% to 173,323. Those supplier shipments rose even as IFR counted Japanese installations down 19% to 36,219. There is no contradiction to resolve by choosing one series: shipments include exports and installations are placed in destination markets. The comparison instead demonstrates how the location of a supplier’s output can diverge from the location and timing of demand. It also cautions against translating a factory’s national production rebound into local buyer demand.[2,6]
The IFR summary says its statistics consolidate data reported by robot suppliers with support from national robotics associations. IFR’s standardized industrial robot category supports annual market comparison, but the public executive summary does not expose the full country tables or the underlying observations used here. The detailed World Robotics publication is copyrighted and its terms restrict reproduction for sales purposes without written permission. This article therefore links the public releases and reports only selected public figures plus transparent calculations. It does not attach or redistribute the paid underlying dataset. The sources measure different stages and populations, so they are evidence for context and triangulation, not rows in one pooled panel.[1,4,5,6]
What buyers can take from the split
For an integrator or component supplier, the global total is a poor standalone capacity plan. A supplier exposed to Chinese electronics or automotive programs faces a different near-term order environment from one selling into a European automotive downturn or Japanese domestic industry. The installation panel identifies where equipment was put in place, not which vendor won, the size of backlogs, project margins, or whether a buyer is ready to release capital. Use it to segment pipeline assumptions by destination and customer industry, then validate those assumptions against current customer orders, project schedules and shipment lead times. The 2025 chart can be a prior, but it cannot substitute for buyer-specific purchase commitments.[1,3,5,6]
The concentration also makes the 2026 outlook more sensitive to China than the headline global forecast suggests. IFR forecast 655,000 installations in 2026, 9% above 2025, an increase of about 51,700 units. If China grew another 10%, it would add roughly 35,400, leaving about 16,300 of the forecast increase to other markets. If China were flat, all other markets together would need to add the full 51,700, equal to about 20.8% of their 2025 base. These are arithmetic scenarios, not IFR forecasts by country. They show why a global forecast can be achieved through very different regional mixes, and why firms should model China exposure explicitly.[1]
The base case for planning can retain IFR’s 655,000 global forecast while avoiding a straight-line extension of China’s 20% year. That scenario assumes growth continues outside China and Chinese installations remain above the 2025 level, but does not require another 20% increase. The adverse case is that China levels off and Europe or Japan remain weak; other markets would then have to deliver unusually strong growth to meet IFR’s global estimate. A third possibility is that the regional ranking changes because companies relocate production. These cases do not assign probabilities. The published evidence is not granular enough to estimate them, and policy announcements or construction plans alone would not establish that robots have been installed.[1,3]
Limits and checkpoints
Three limits should travel with the result. First, the installation comparison uses one statistical family: IFR’s public report and releases. Separate IFR documents are not independent replications of the installation totals. Second, the region and country releases provide selected totals; they do not establish causes such as tariffs, AI investment, reshoring or factory expansion. Those may be plausible drivers in the source commentary, but this comparison does not identify their effects. Third, the 2025 installation count is backward-looking and says nothing directly about 2026 contract conversion, commissioning delays, average robot prices, utilization or return on investment. The NBS, A3 and JARA figures cannot close these gaps because they count output, orders and supplier shipments on different bases.[1,2,3,4,5,6]
Two checks can change how strongly the conclusion should be used. When IFR next publishes a comparable 2026 country installation table, recalculate China’s share of the annual total and the regional rates. If China falls below half of worldwide installations, the majority-share premise no longer applies to that year. Separately, if a revision to the 2025 table reduces China’s share below 55%, or reverses the sign of the European decline, revise the historical comparison and its planning interpretation. Until comparable new data arrive, a buyer should treat this as a destination-specific snapshot and test it against current customer commitments, rather than assume the 2025 mix is a durable market law.[1,2]