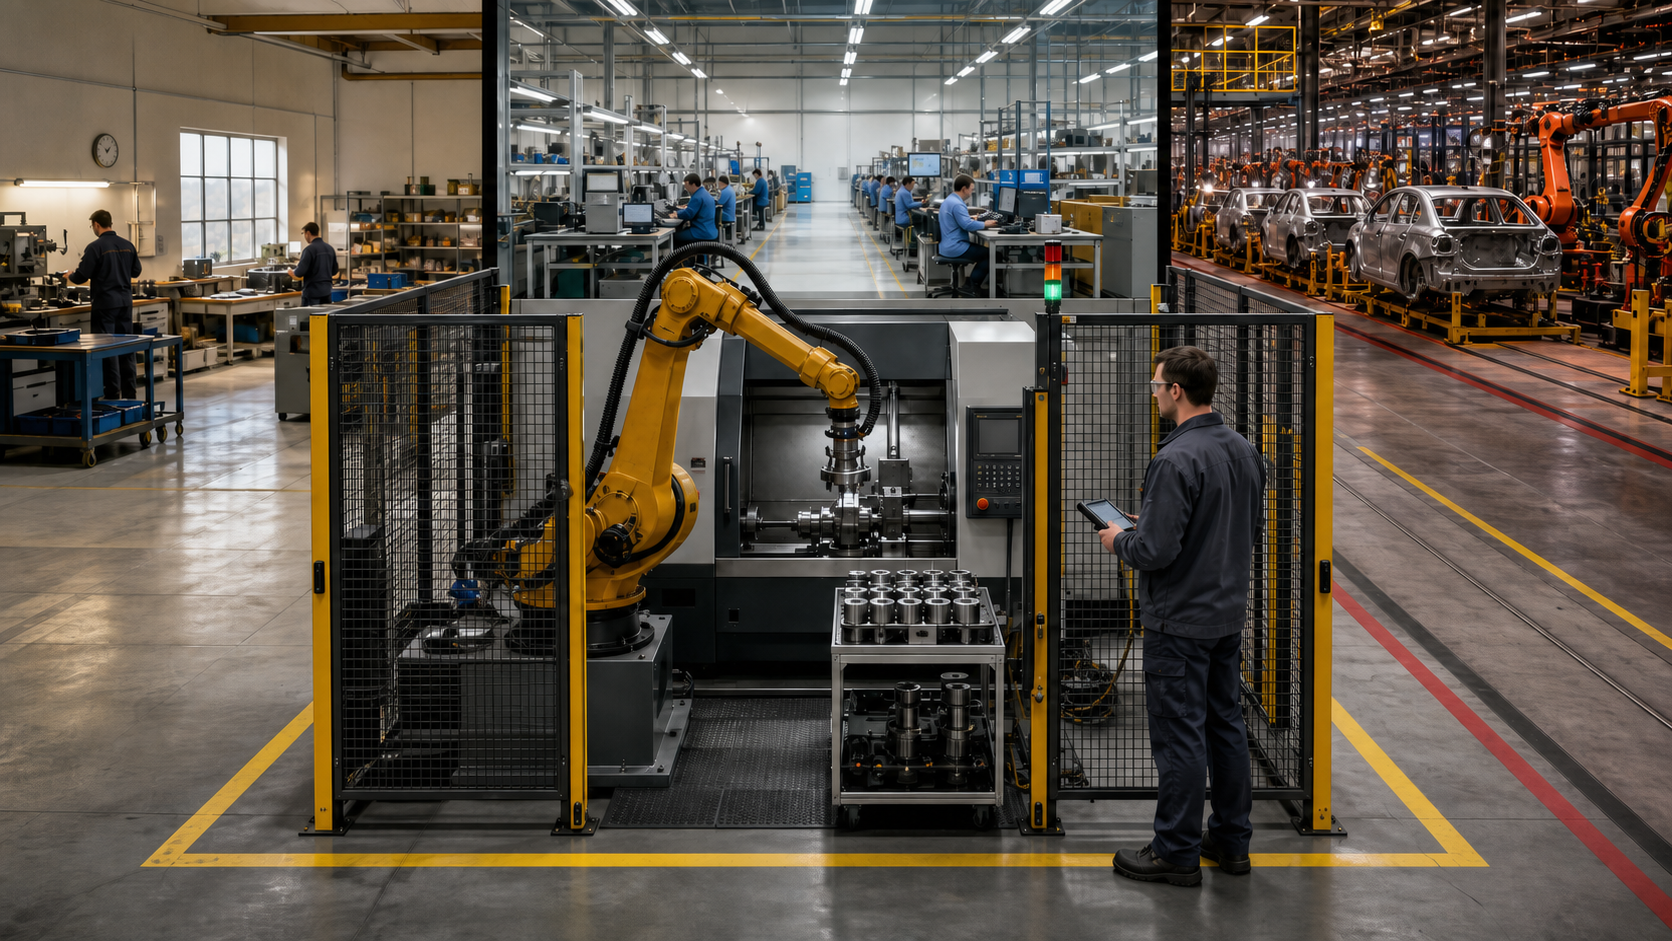
The finding
Industrial robot economics do not resolve into a clean country ranking or a list of jobs that disappear first. They begin with a denominator. In this report's disclosed base case, the same cell carries $54,000 of annual modeled cost. Spread across 1,600 productive hours, that is $33.75 per hour. At 4,800 hours, it is $11.25. The threefold difference is a property of the model's utilization assumption, not evidence that a particular task will automate, that one robot hour replaces one worker hour, or that a named company or country will lose workers.[1,2,3,4,6,7]
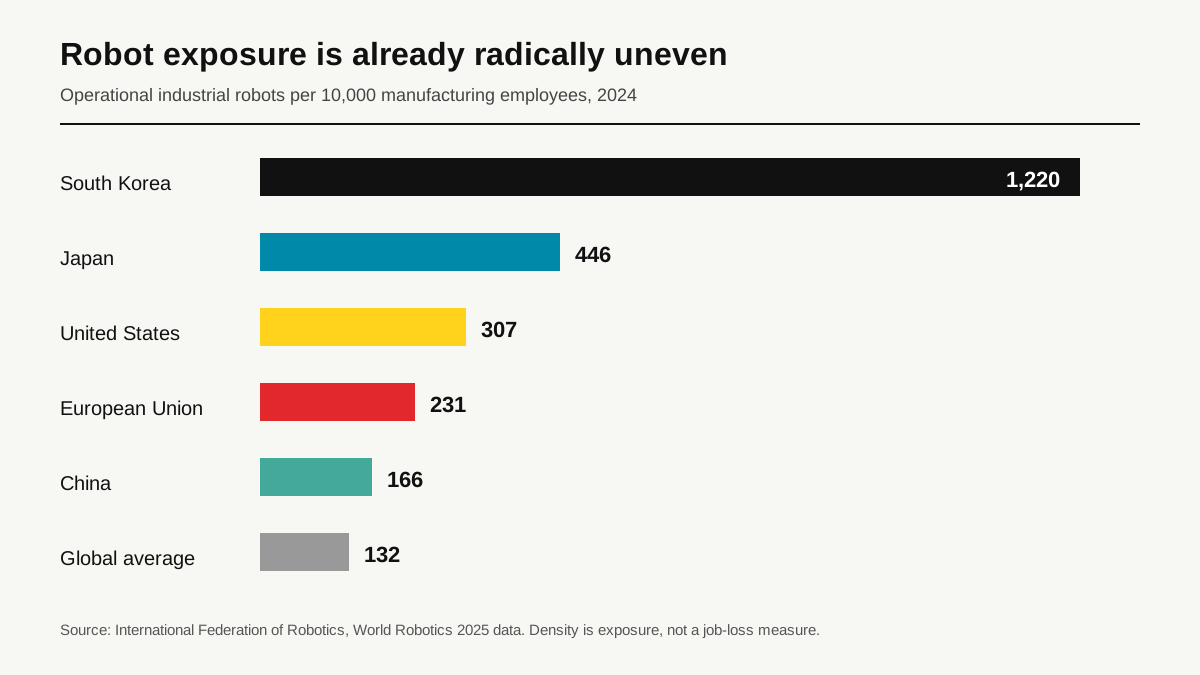
That distinction matters because the usual global comparison starts with robot density. The International Federation of Robotics reports 1,220 operational industrial robots per 10,000 manufacturing employees in South Korea in 2024. Japan recorded 446, the United States 307, the European Union 231, and China 166, against a global average of 132. The range is real and economically important. It shows where factories have already accumulated automation capital. It does not show how many hours each robot runs, which tasks it performs, whether output grew, or what happened to employment at comparable plants.[1]
Density is not destiny
South Korea's density is almost four times the U.S. level, yet that ratio cannot be converted into four times the labor displacement. IFR explains that Korean density is anchored in large electronics and automotive industries. China presents the opposite scale problem: its density is lower because the manufacturing workforce is enormous, while its operational stock is about two million robots and 295,000 installations in 2024 represented 54% of the world total. A density denominator can make a huge installed market look moderate and a specialized manufacturing economy look extreme. Neither result supplies a causal employment estimate.[1]
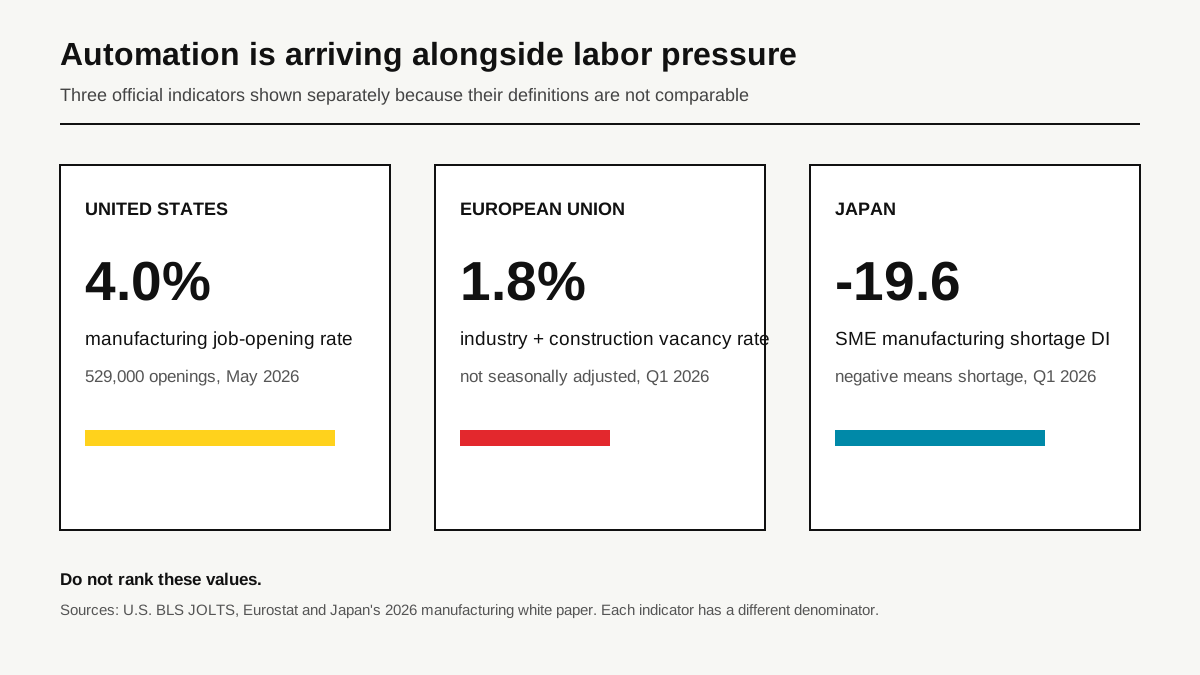
Current labor records also resist a simple replacement narrative. U.S. manufacturing had 529,000 job openings in May 2026, a seasonally adjusted opening rate of 4.0%, while hires were 287,000 and separations 277,000. In the EU, the Q1 2026 vacancy rate for industry and construction was 1.8% on a not-seasonally-adjusted basis. Japan's 2026 manufacturing white paper says manufacturing employment fell from 10.55 million in 2023 to 10.33 million in 2025, but its shortage diffusion index for small and medium manufacturing firms reached -19.6 in Q1 2026, close to its pre-pandemic shortage level. Falling employment and employer-reported scarcity can coexist.[2,4,7]
The utilization gate
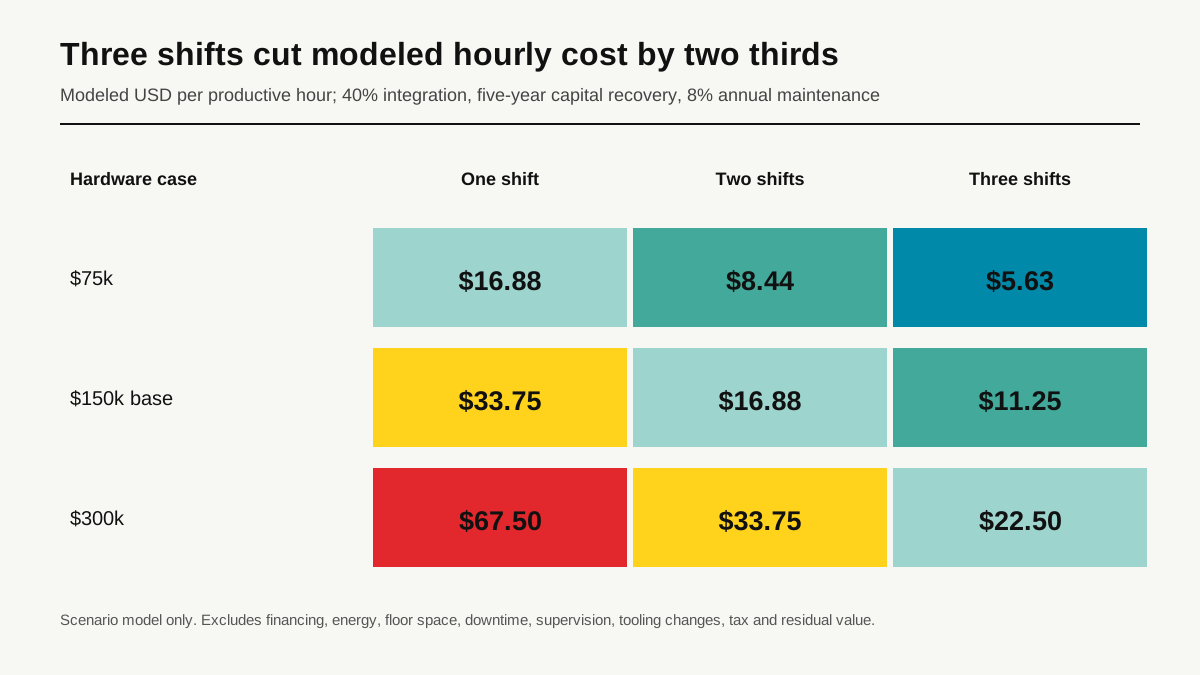
To isolate the operating mechanism, The Robot Economy built a deliberately simple cost screen. It tests three hardware prices: $75,000, $150,000, and $300,000. Integration adds 40% to hardware cost. Installed cost is recovered over five straight-line years, and annual maintenance equals 8% of hardware cost. Productive utilization is 1,600 hours for one shift, 3,200 for two, and 4,800 for three. The calculation is annualized cost divided by productive hours. It is not a quote from a vendor and does not pretend that every cell has the same gripper, guarding, software, commissioning burden, or useful life.[1,3,5,6]
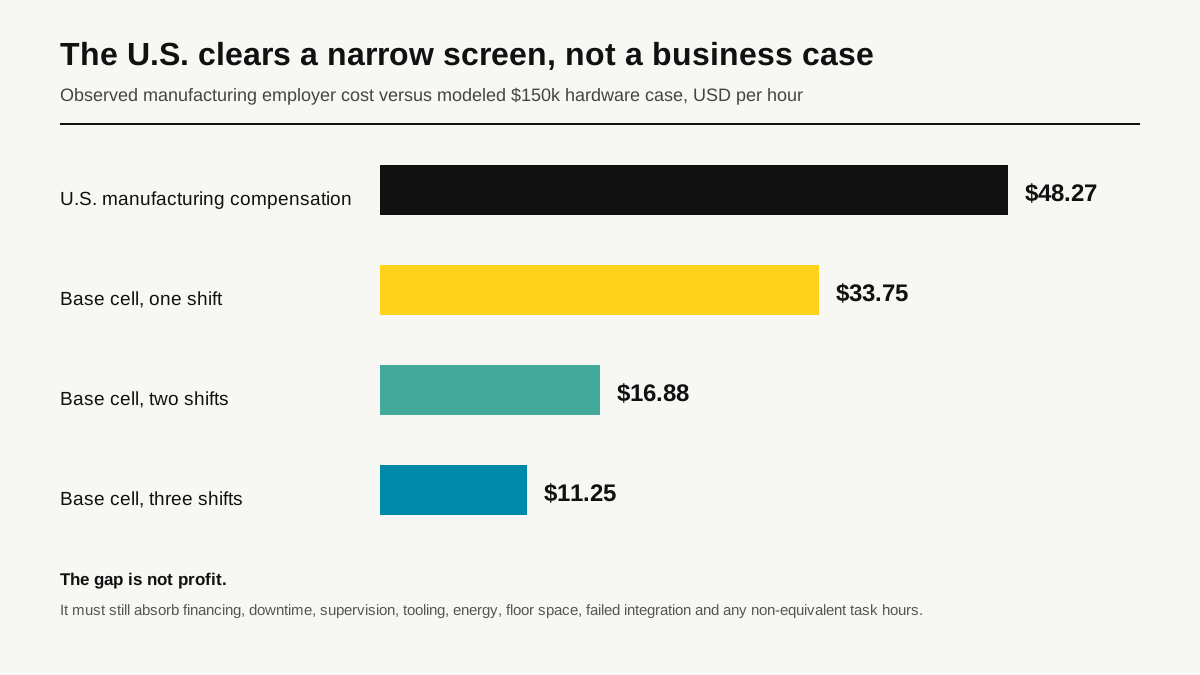
The base $150,000 hardware case becomes a $210,000 installed cell under the integration assumption. Annual capital recovery is $42,000 and maintenance is $12,000, producing $54,000 of annual modeled cost. That equals $33.75 per productive hour on one shift, $16.88 on two shifts, and $11.25 on three. The $300,000 case costs $67.50 per productive hour on one shift but $22.50 on three. The machine did not become cheaper; the denominator changed. The arithmetic shows how strongly operating hours affect a project screen. It does not establish that any particular application supplies those hours or clears the omitted costs.[1,3]
The U.S. screen
The cleanest available labor comparison is inside one country and one hourly definition. BLS reports that total employer compensation for all private manufacturing workers averaged $48.27 per hour in March 2026, comprising $32.20 in wages and $16.07 in benefits. That industry average is above the model's $33.75 one-shift base case. The $14.52 gap is not profit. It still has to absorb financing, energy, floor space, programming, tooling, supervision, downtime, changeovers, scrap risk, training, and any hours where the robot does not perform work equivalent to the labor measure.[3]
The comparison explains sensitivity, not sequence. A buyer with two shifts, expensive overtime, and a vacancy problem has more room inside a gross cost screen than a one-shift buyer using the same modeled hardware. What happens after that screen depends on the real cell's availability, throughput, interventions, financing, tooling, and supervision. Employment adds another layer: demand, worker redeployment, attrition, bargaining, and plant strategy can turn the same technical project into capacity growth, overtime reduction, consolidation, or no deployment at all. The opened records do not identify which outcome occurred.[2,3]
Why the country ranking breaks
A global wage league table would create false precision. Eurostat's 2025 average hourly labor cost was EUR34.9 across the EU whole economy, with country values ranging from EUR12.0 in Bulgaria to EUR56.8 in Luxembourg. The measure includes wages, salaries, employer social contributions, and employment taxes minus subsidies, but it is not manufacturing-specific. China's 2025 record reports 100,572 yuan in average annual wages for manufacturing employees at enterprises above designated size and 79,182 yuan for production and manufacturing workers within that enterprise category. Those are annual wages, not total employer costs. Currency conversion would not repair the scope difference.[5,6]
Lower wages also do not end the automation case when equipment supply, financing, industrial policy, or local integration costs move. China's National Bureau of Statistics says industrial enterprises above designated size produced 537,689 industrial robots in the first six months of 2026, up 28% from the same period, including 110,702 in June. That output does not cover every Chinese producer, is not domestic installation, and says nothing about utilization. It nevertheless establishes a bounded supply-side measure that a wage-only model misses.[6,8]
What the model cannot rank
The model ranks cost scenarios, not tasks. More productive hours spread the assumed annual cost across a larger denominator, but none of the opened datasets reports productive robot hours, intervention burden, task throughput, fully loaded project cost, and employment outcomes for the same plants. Without those records, this report cannot honestly rank machine tending, palletizing, welding, inspection, material movement, or any other application. Repeatability and stable demand may be relevant project variables, but their effect has to be measured rather than inferred from national robot density.[1,2,3,7]
A task-bundle mechanism remains plausible but unproven by this dataset. One production role can contain machine feeding, inspection, jam resolution, replenishment, and quality documentation. Automating one component would not mechanically reveal what happens to the role: the remaining work could stay together, move to another worker, require new technical support, or disappear if demand also changes. Company-level headcount therefore cannot be read from the robot-density chart or from the cost model. It requires plant-level records before and after deployment.[2,7]
Possible distributional effects remain serious: automation could reduce entry-level pathways or overtime income, change bargaining power, raise demand for technicians and exception handlers, and move value toward integrators, software suppliers, or capital owners. Smaller firms may also face different financing and staffing constraints from large manufacturers. None of the opened national datasets measures those internal effects directly, so they are questions for follow-up reporting rather than findings. The defensible conclusion here is narrower: utilization materially changes modeled hourly cost, while density and national labor aggregates are insufficient to predict employment.[1,3,5,6,7]
Three operating scenarios
- High-utilization case: 4,800 productive hours put the base cell at $11.25 per hour before omitted costs. The model does not determine the application, throughput, or employment result.
- Middle case: 3,200 productive hours put the base cell at $16.88 per hour. Integration quality, downtime, supervision, and exception handling still determine whether a real project clears.
- Low-utilization case: 1,600 productive hours leave the base cell at $33.75 per hour and the high-cost cell at $67.50, before financing, changeover, and other omitted costs.
What would change the conclusion
The most useful next evidence is not another humanoid demonstration or national robot count. It is a matched plant record with task hours, productive robot hours, intervention rate, throughput, defects, overtime, vacancies, headcount, redeployment, and fully loaded project cost before and after installation. By June 2027, repeated one-shift projects that achieve attractive returns after financing, downtime, supervision, and tooling would weaken the claim that utilization is a dominant project screen. By December 2027, matched studies should reveal whether productive hours predict fully loaded project economics after controlling for hardware, integration, task variation, and demand.[1,2,3,4,7]
The report should also be revised when comparable plant records become available. A sustained move from shortage signals to broad manufacturing labor surplus in high-density economies would still not prove that robots caused the change, but it would identify where causal research is most urgent. Until matched records exist, the operational decision is narrower: measure productive hours, interventions, throughput, and fully loaded cost at the cell, then measure vacancies, overtime, redeployment, and headcount separately. Country indicators supply context; they do not close the causal chain.[1,2,4,7,8]
Method and limitations
This report opened eight primary datasets or official records from five publishers, preserved each source's geography and denominator, and published the underlying observations and nine cost scenarios in a downloadable appendix. The cost equation is: annualized cost equals installed cost divided by five plus annual maintenance; effective hourly cost equals annualized cost divided by productive hours. Installed cost is hardware multiplied by 1.40, and maintenance is hardware multiplied by 0.08. The model does not estimate taxes, subsidies, depreciation rules, financing, energy, residual value, floor space, downtime, supervision, changeover, quality losses, or the probability of failed integration.[1,2,3,4,5,6,7,8]