Start with the unit behind the score
A robot-policy average is useful only when its test unit is clear. On 21 October, RoboDojo added InternW0-Δ to its physical leaderboard. The 24 October snapshot reports a 38.9 progress score and 31.7% task success rate. Those are different measures, and neither is a claim about hours of unattended work at a customer site. The new result provides a reason to examine the ledger underneath the headline.[1,2]
One average contains three different task bundles
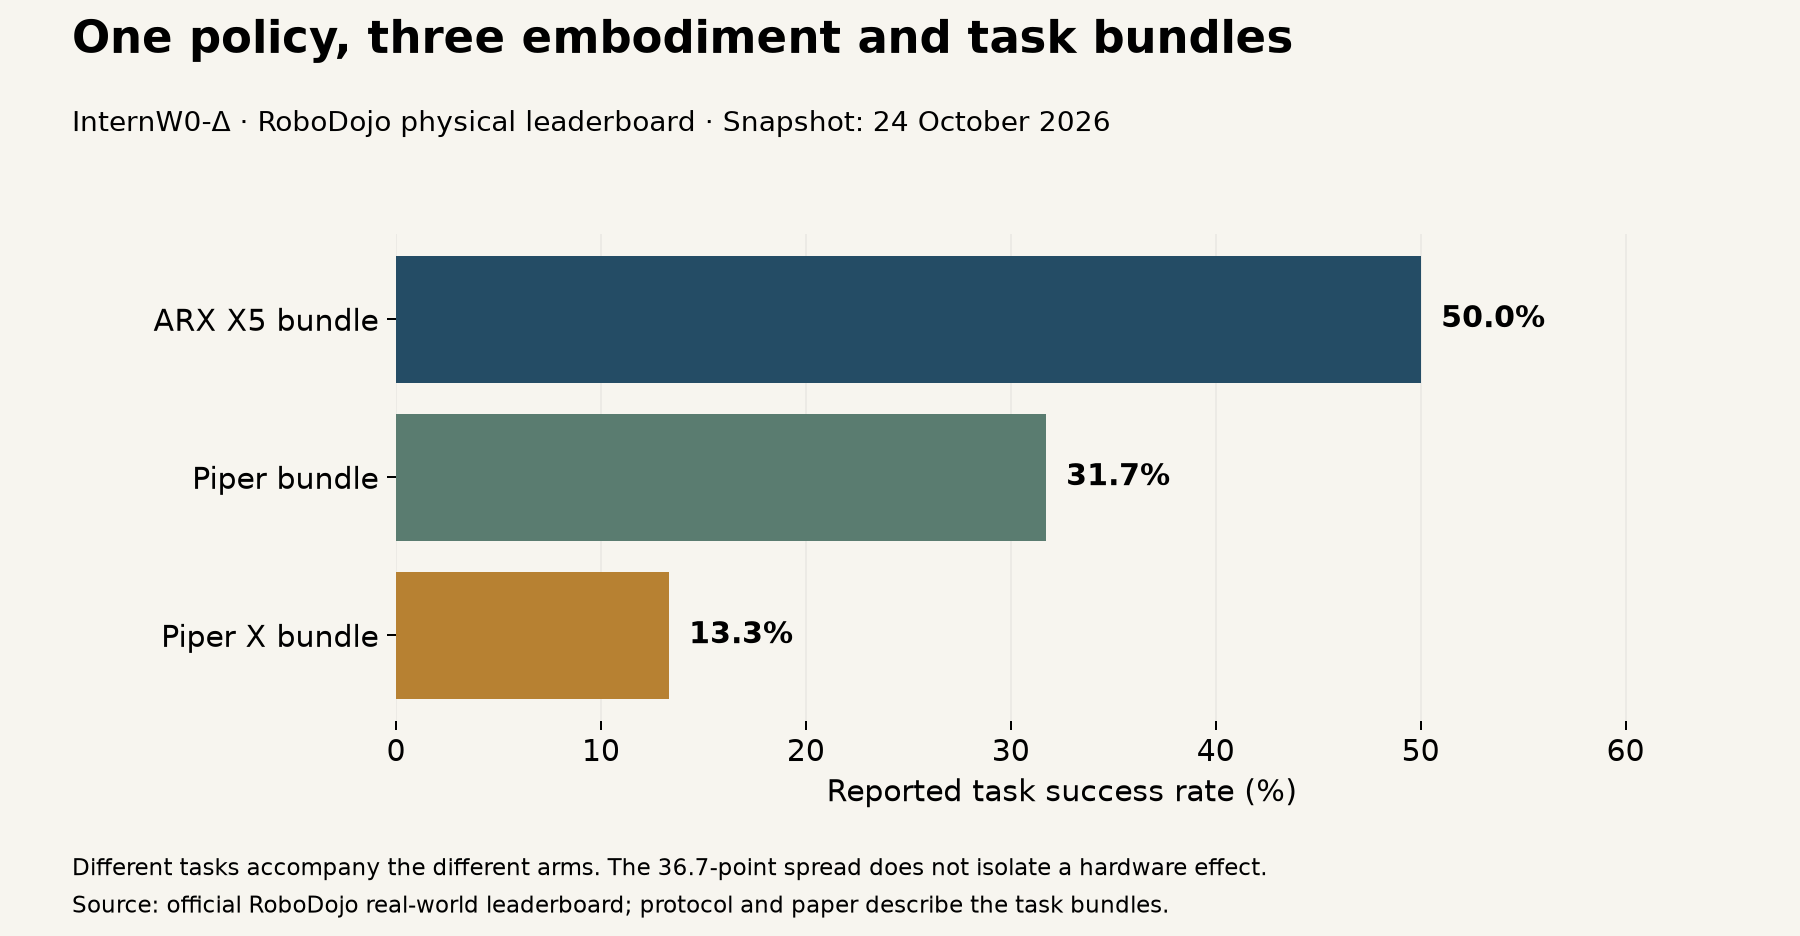
The same entry reports 50.0% success for the ARX X5 bundle, 31.7% for Piper and 13.3% for Piper X. The highest-to-lowest spread is 36.7 percentage points. But the benchmark assigns different tasks to the different embodiments. This panel cannot isolate a hardware effect, and it does not show the same task transferring successfully between three arms.[1,2]
For a pilot decision, the useful next request is a matched task specification: objects, initial layouts, success criteria, controller and intervention rules. Without it, selecting the highest bundle score risks choosing a different task rather than a more capable system. This is a limit on the comparison, not evidence that the reported score is wrong.[1,2]
Separate the physical and simulated ledgers
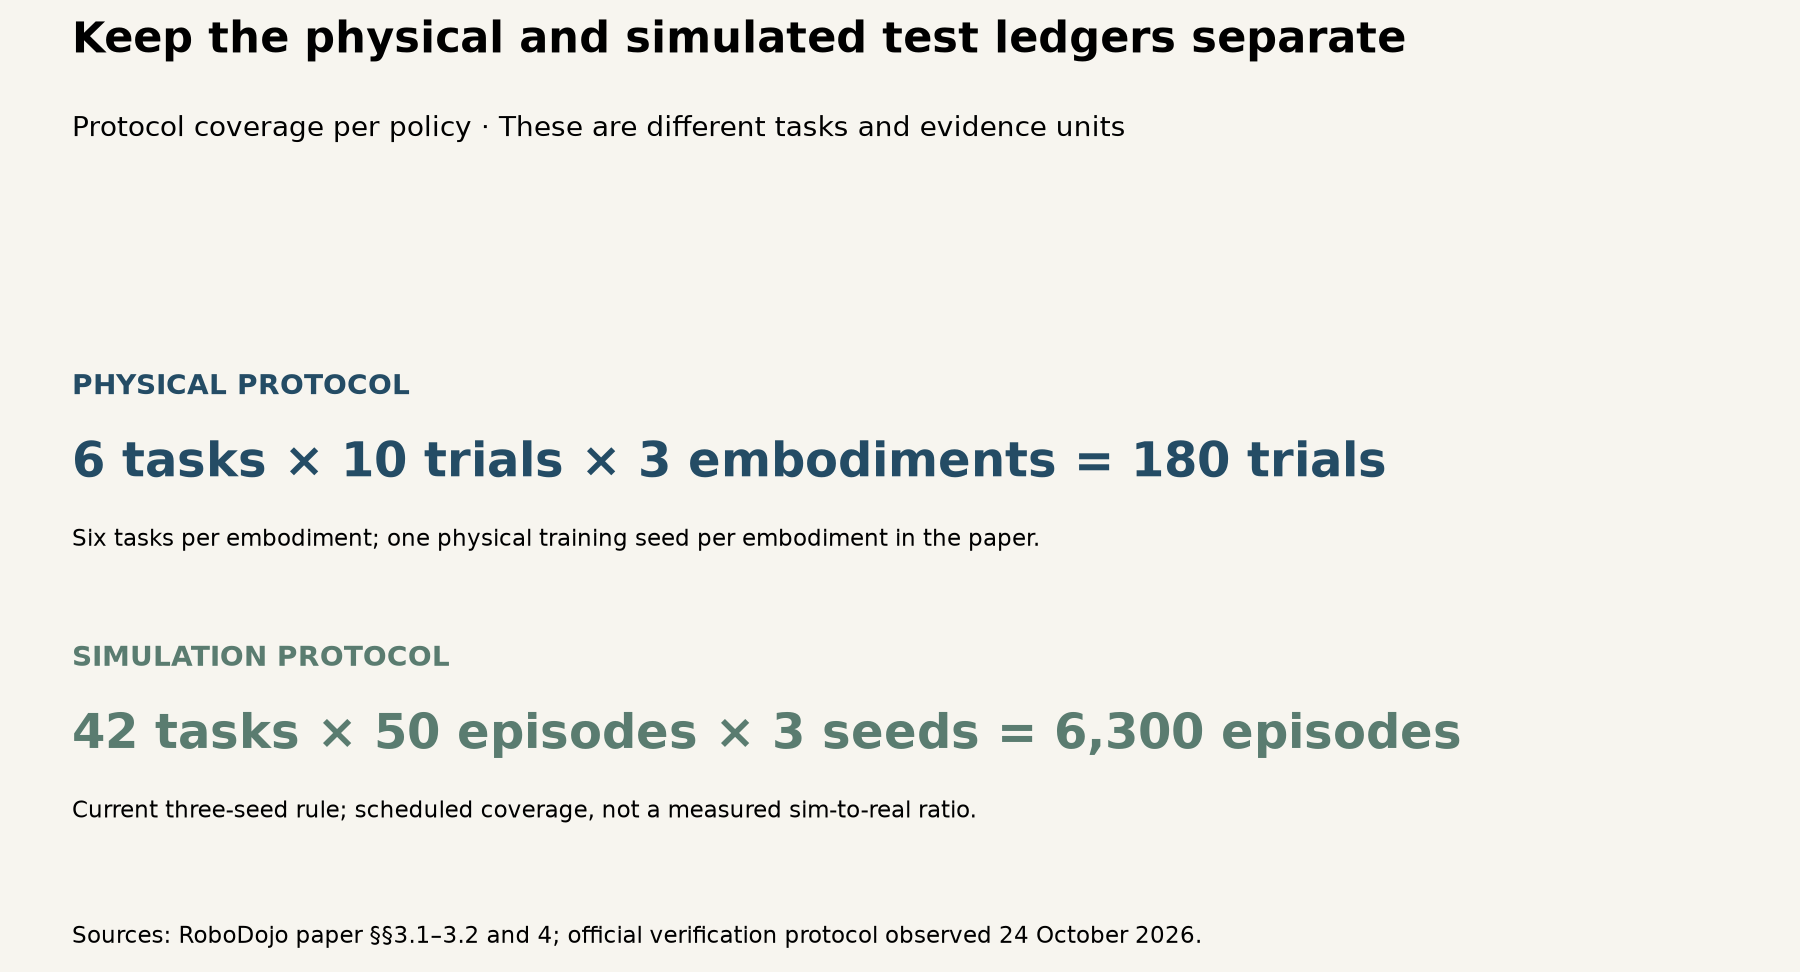
The RoboDojo paper specifies 18 physical tasks across three embodiments, six per embodiment, with ten trials per task. That gives 60 trials per embodiment and 180 per policy. The paper separately describes 42 simulation tasks and 50 episodes per task. Combined with the current official three-seed rule, the simulation plan implies 6300 episodes: 42×50×3. These task sets are not aligned one-to-one.[2,3]
The paper also reports 202 minutes for 180 physical trials using π0.5 on a local RTX 4090 server, including resets, inference and execution. That is a measured configuration, not a completion-time guarantee for InternW0-Δ or a labour-cost estimate. A different policy, network path or task duration can change the total. Trial counts define coverage; elapsed time needs its own operating boundary.[2]
A verified-entry rule is another distinct claim
RoboDojo’s current protocol requires the official evaluation pipeline, repeated simulation seeds, all three physical embodiments, hidden-layout checks, videos and release of the evaluated artifact for verified publication. It also requires a fixed system rather than switching to a different known-best policy for each task. The protocol allows three days after listing to release the required artifacts, with removal possible after that deadline. These are the published rules. This report has not audited every checkpoint, video or compliance decision behind the current leaderboard.[3]
RoboArena: reconcile comparisons with rollouts
RoboArena describes 612 pairwise comparisons involving seven policies. In its exhaustive reference evaluation, the other five policies were tested after each A/B pair on the same task. The ledger therefore contains 1224 paired-policy rollouts plus 3060 additional rollouts, totaling 4284. That matches the paper’s reported evaluation total. It does not mean there were 4284 independent head-to-head matchups.[5]
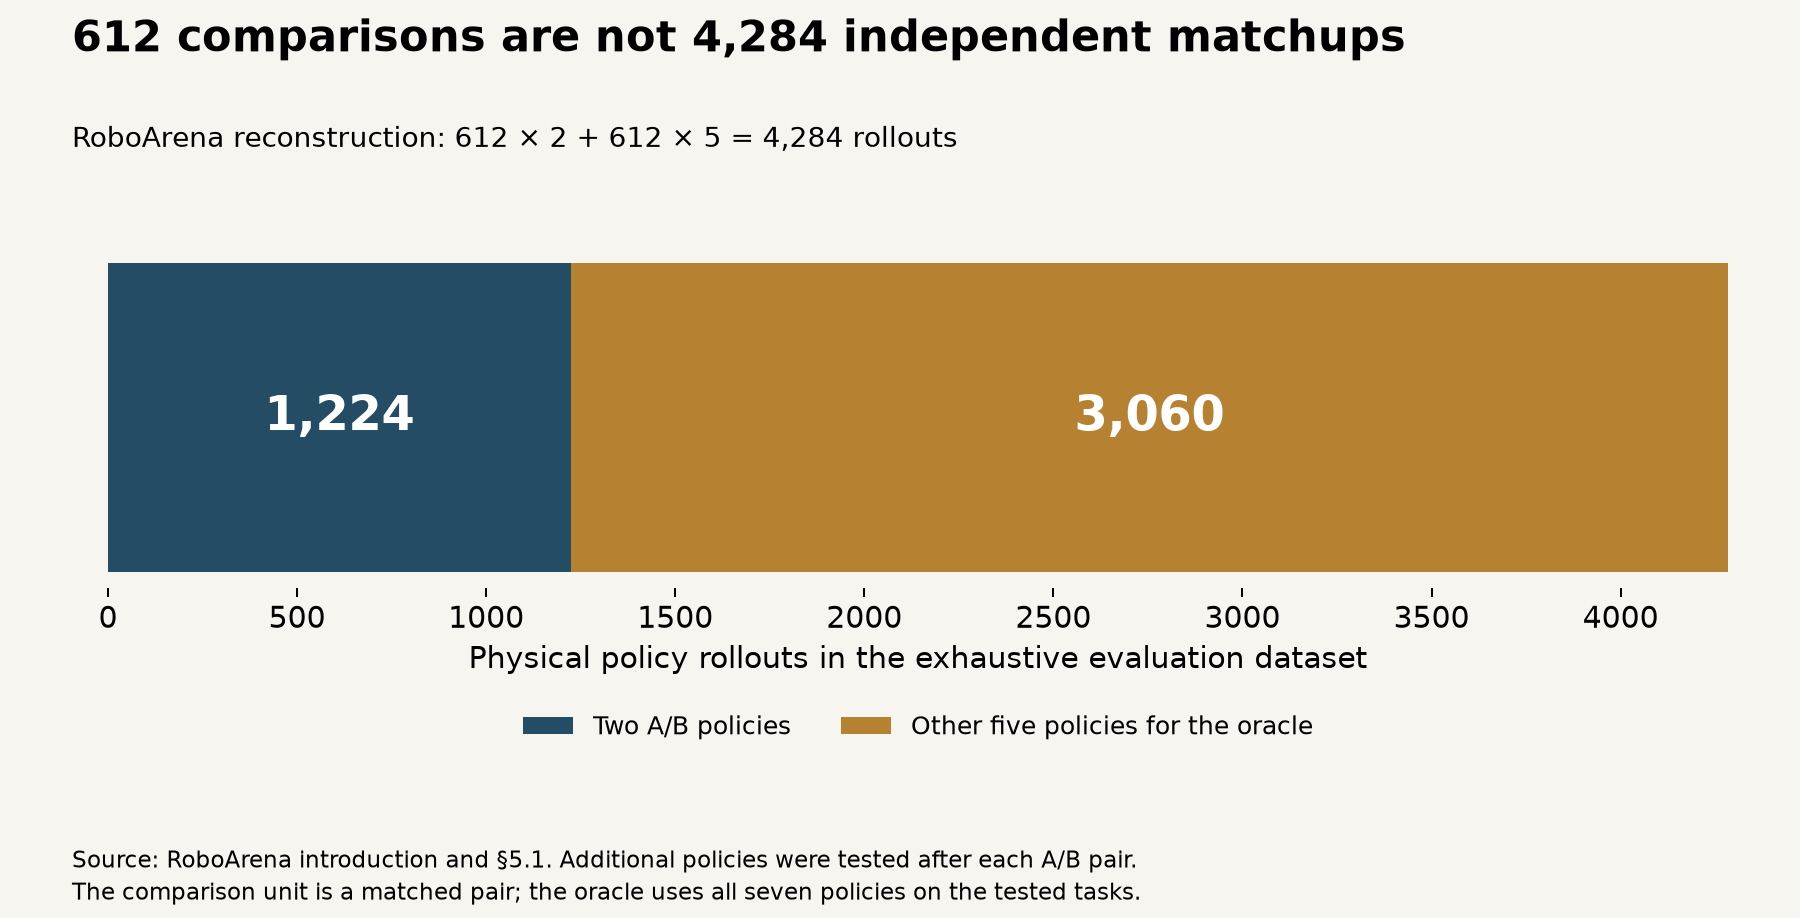
This distinction changes sample planning. A buyer reproducing a seven-policy reference evaluation needs a different run allocation from a buyer comparing two shortlisted policies. The published totals describe those evaluation designs; they do not provide a common reliability ranking against RoboDojo. RoboArena’s DROID platform uses a Franka Panda arm, which also explains the hardware context of this report’s archive cover.[5]
Australia and Germany add two more boundaries
A Macquarie University study defaults to 50 trials per task, model and evaluation setting. Timeout, horizon and safety stop count as failures; randomized initial states are reused across models. A success percentage without those stopping rules would omit part of the experiment. We use that protocol to define a useful comparison request, not to combine its success rates with RoboDojo’s.[4]
CALVIN adds a different unit again: a simulated sequence of up to five language instructions. Its long-horizon result depends on completing tasks in sequence rather than merely pooling isolated attempts. A sequence, an independently reset physical trial and a matched A/B comparison answer different questions. Calling all three an episode would not make their scores interchangeable.[6]
What an operator can use next
Our synthesis uses six substantive primary records across RoboDojo, RoboArena, Macquarie and CALVIN. The projects use distinct protocols; some consortium affiliations overlap, and none independently reproduces the new RoboDojo result. We preserve the 24 October snapshot, recalculate three ledgers and publish the inputs as CSV. No confidence interval is inferred from rounded leaderboard values or unaudited trial counts. No benchmark-to-factory reliability conversion is estimated.[1,2,3,4,5,6]
Under the base scenario, current task and scoring differences persist. Treat each benchmark as evidence about its stated conditions, then ask for a pilot ledger recording complete attempts, resets, stopping reasons and human interventions. If a later release supplies matched tasks and the same fixed system across hardware, the embodiment comparison becomes stronger. If the evaluated artifact cannot be reproduced, confidence in using the published score for a pilot weakens.[1,2,3,4,5,6]
At the next physical leaderboard update, check whether the same policy artifact and task definitions accompany per-embodiment results. At the next attempted reproduction, count all planned trials and reconcile successes, stops and interventions before reporting a new average. For any RoboArena comparison, state separately the number of matched pairs and the number of individual policy rollouts. Those observations can strengthen or overturn the practical interpretation here.[1,2,3,4,5]
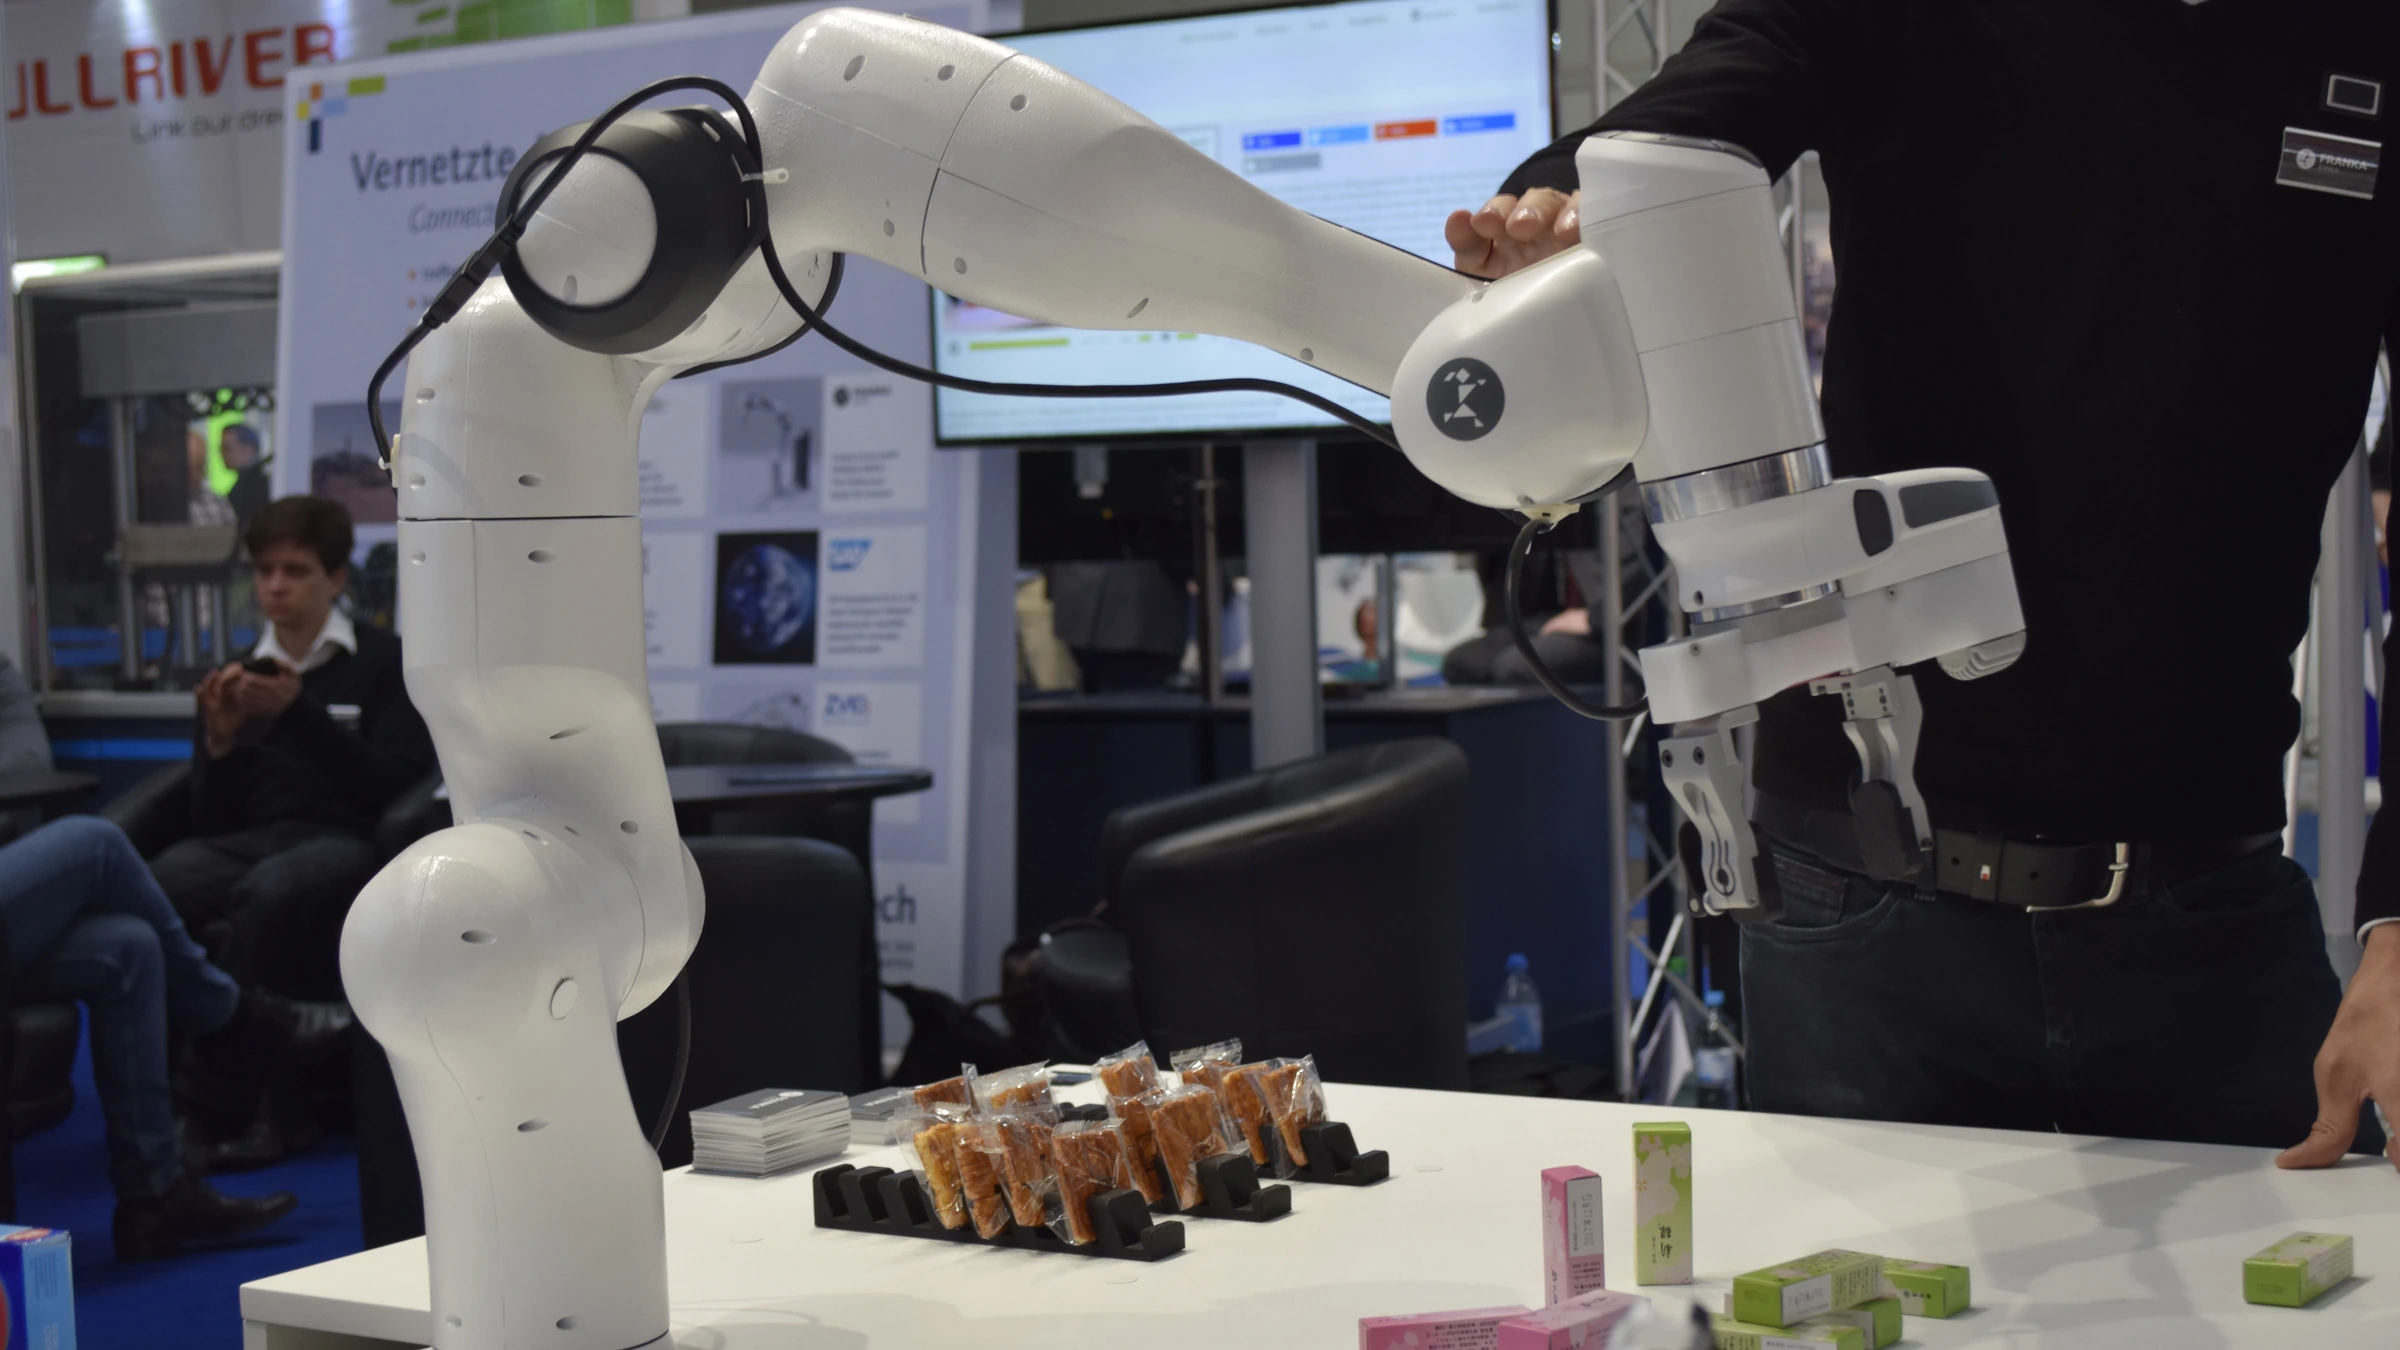
Cover context: Ims photographed a Franka Emika arm at CeBIT in Hannover on 23 March 2017. It illustrates related robot-arm hardware, not a DROID rig, a RoboArena test scene or the RoboDojo ARX/Piper experiments. Source: Wikimedia Commons, CC BY-SA 4.0; cropped and resized, with this derivative photograph under the same license.[7]
