Anthropic’s September 30 robot study estimates that existing machines can perform tasks representing 34% of U.S. working time in some environment, while only 0.3% is cost-competitive. Those are modeled shares of work, not measured job losses or a census of profitable installations.[1]
For buyers, the useful comparison is between three different records: the model’s capability rating, the cost assumptions behind it, and evidence from the specific workplace. A high exposure score can identify a task worth investigating without establishing a business case.[1,2,3,4]
The government supplies tasks; the model supplies judgments
The released data use occupational tasks from O*NET, the U.S. Department of Labor database. Their documentation identifies Claude Opus 5 as the model assigning physical-task ratings with web search. It also defines each task’s time share as Claude’s estimate, and labels cited evidence as deployed, commercial or demonstration.[2]
This distinction makes the data useful to audit. A government task description and a model’s interpretation of that task have different evidential status. Buyers can reopen a cited example, compare its setting with their own, and test whether the work left outside the example changes the proposed installation.[2]
Anthropic rates capability by the amount of environmental control a robot needs. Its cost estimates include annualized hardware and installation, maintenance, energy and human support. The authors caution that summing task costs can double-count equipment or miss coordination costs.[1]
A labor benchmark is only one side of the comparison
The Bureau of Labor Statistics reported June 2026 private-industry compensation averaging $46.89 per hour: $32.82 in wages and $14.07 in benefits. Benefits made up 30% of the total. These are broad employer-cost averages, not the wage or replacement cost of a particular plant’s worker.[3]
Comparing a robot quotation with cash wages alone can therefore misstate the labor side. Comparing it with an economy-wide compensation average can also misstate the site. The relevant calculation needs the local role, usable output, integration expense and human work retained after automation. The government benchmark does not independently verify Anthropic’s robot-cost estimates.[1,3]
Real factory activity still needs its own economics
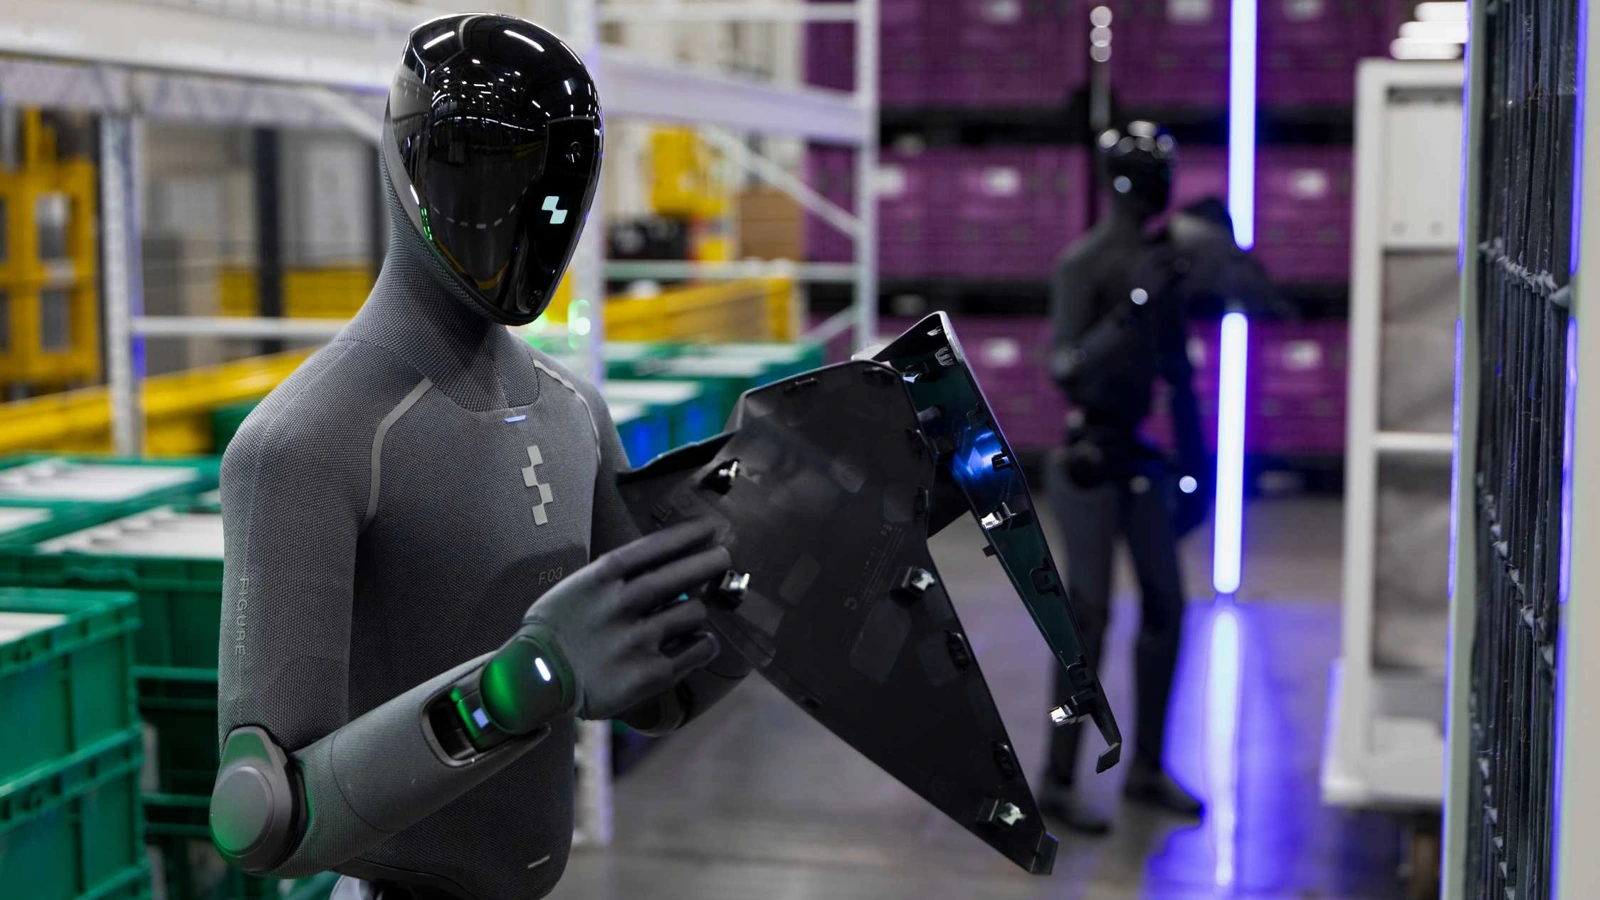
BMW’s June 25 release, cited by the study, describes a Figure 03 logistics application: picking unsorted parts into a sequencing trolley, followed by onward automated transport. This is a concrete workflow, with multiple systems and handoffs. The release supplies no comparable full operating-cost account for that Figure 03 workflow.[4]
That example also limits a pessimistic reading of the aggregate estimate: a low modeled share of cost-competitive work does not establish that every robot project is uneconomic. Nor does a working factory example prove the wider model correct. Different sites can have different constraints and benefits.[1,4]
The next useful checkpoint is a comparison between the chosen task’s model assumptions and a customer’s measured installation: accepted output, intervention hours and total costs over a defined period. Until then, exposure is a research starting point; payback remains a separate finding to establish.[1,2,3,4]