The answer is yes, when the denominator matches
Robotaxi ride growth can be separated from fleet growth, but a larger trip total is not enough. The useful denominator is the sum of days or hours that the relevant vehicles were available for the same service. The disclosures examined here establish growing service volume and some efficiency improvements. They do not establish a comparable global ranking of trips per active car.[2,3,4,7]
That distinction matters as service areas expand. On 27 October 2026, Waymo announced plans to add nearly 250 square miles across five cities over the following week. New territory can add customers, longer journeys and repositioning work at the same time. An expanding map identifies a deployment change; it does not measure how hard each car works.[1]
Separate cars, vehicle-time and trips
For a defined market and service, completed trips equal active vehicle-days multiplied by completed trips per active vehicle-day. An active vehicle-day counts one eligible car on one day; a fleet snapshot counts cars at a single instant. Eligibility must specify paid or free rides, driverless or supervised service, and how partial days, downtime and charging are treated. For a cleaner capacity comparison, use available vehicle-hours and keep the definition stable.[2,3]
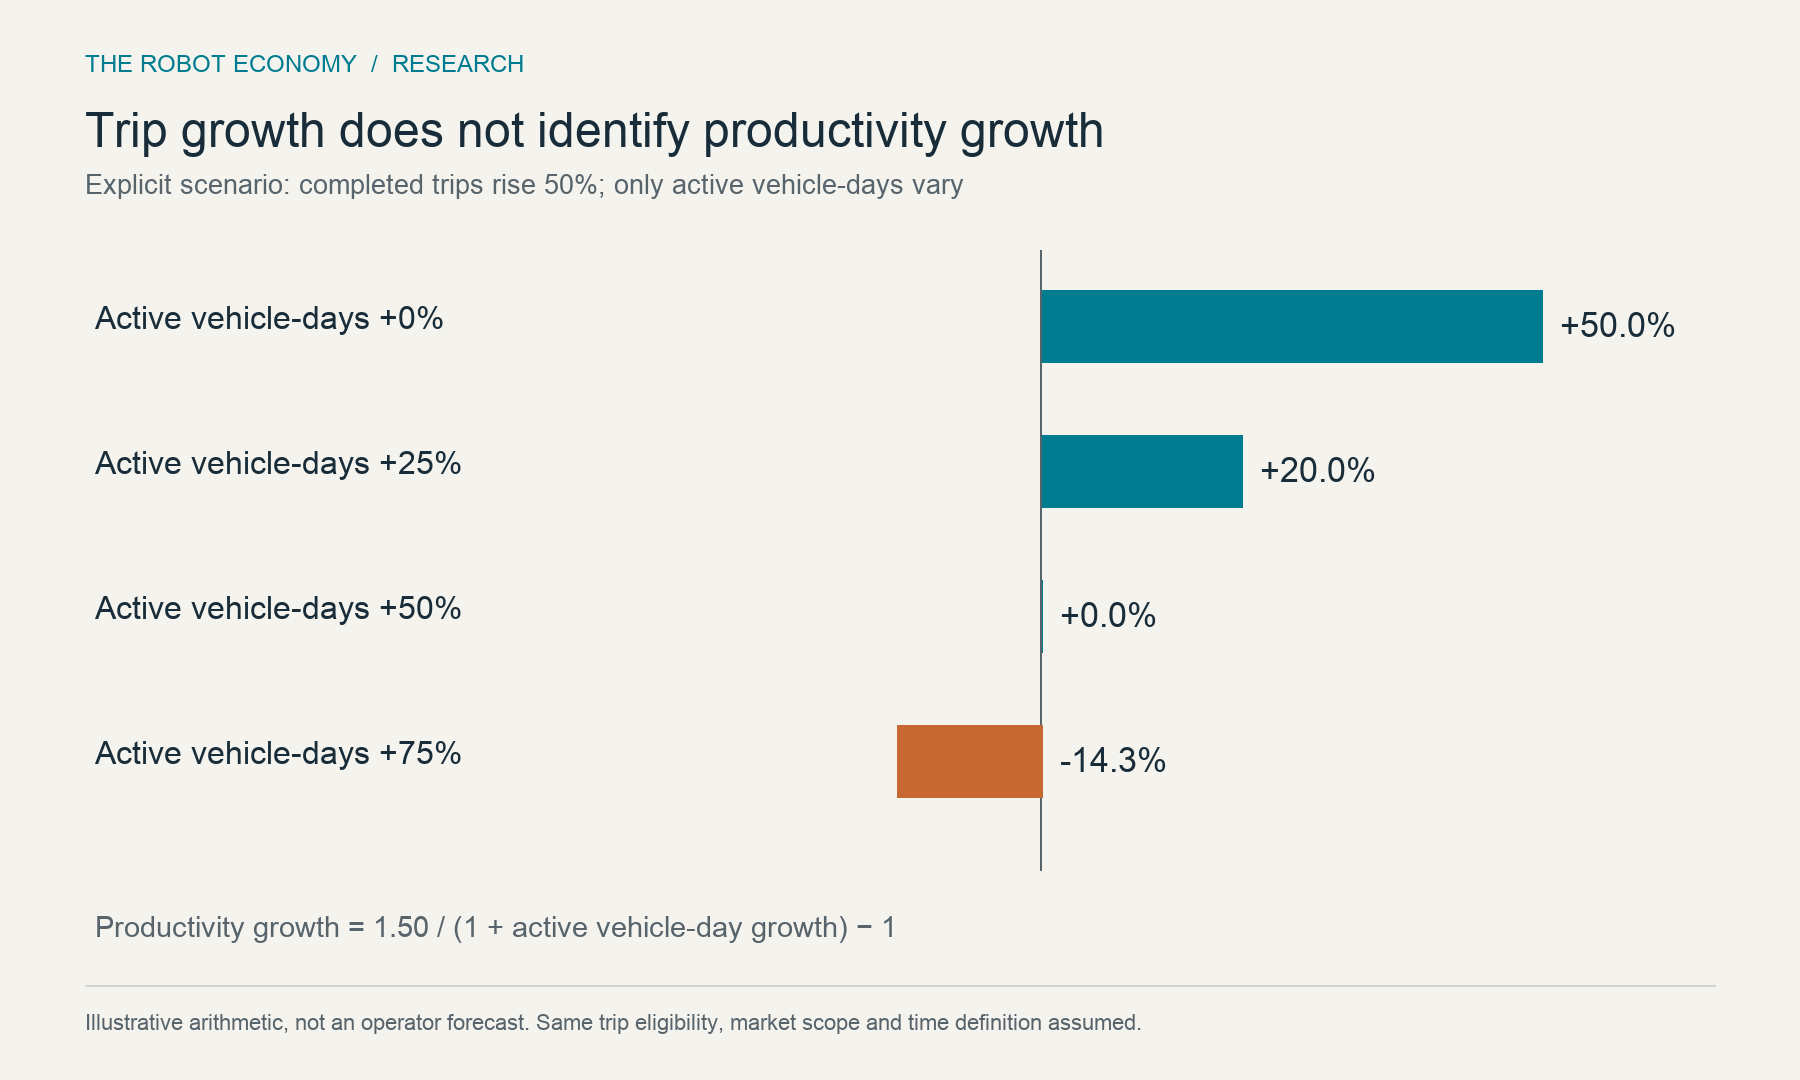
The arithmetic is multiplicative. If trips increase 50% and active vehicle-days increase 25%, trips per active vehicle-day rise 20%: 1.50 divided by 1.25, minus one. If both rise 50%, productivity is unchanged. If vehicle-days rise 75%, productivity falls 14.3% despite the higher trip count. These are explicit scenarios, not estimates of any operator.[2,3]
Even an accurate quarter-end fleet is insufficient. Consider a hypothetical 30-day month with 100 active cars for 15 days and 200 for 15 days: 4,500 active vehicle-days. At 90,000 trips, output is 20 trips per active vehicle-day. Dividing by the final 200 cars and all 30 days gives 15, understating the same output by 25%. The deployment schedule matters.[2]
California: measurable mileage gains, missing fleet productivity
California publishes quarterly deployment-report links, with confidentiality redactions. The latest posted period on the page inspected was April–June 2026. July–September reports are due 1 November; that is a submission deadline, not a promise of same-day publication. This report uses an accessible author-published reconstruction of earlier regulatory data for its numerical California panel, rather than claiming a new extraction of the latest archives.[2,6,7]
We downloaded the monthly dataset attached to Awad Abdelhalim’s May 2026 Findings paper and selected August 2023–December 2025. The 29 rows total 13,790,147 completed trips and about 86.27 million vehicle-miles, reconciling to the paper’s aggregate table. Three earlier rows were excluded. The file contains no active vehicle-day or vehicle-hour series, so it cannot supply a fleet-adjusted productivity trend.[6,7]
Our recalculation finds 1,257,187 trips in December 2025 versus 541,378 in December 2024, an increase of 132.2%. Because both months have 31 days, calendar-day volume rises by the same percentage, from about 17,464 to 40,554 trips. Calendar normalization corrects month length; it does not correct fleet size or service availability.[7]
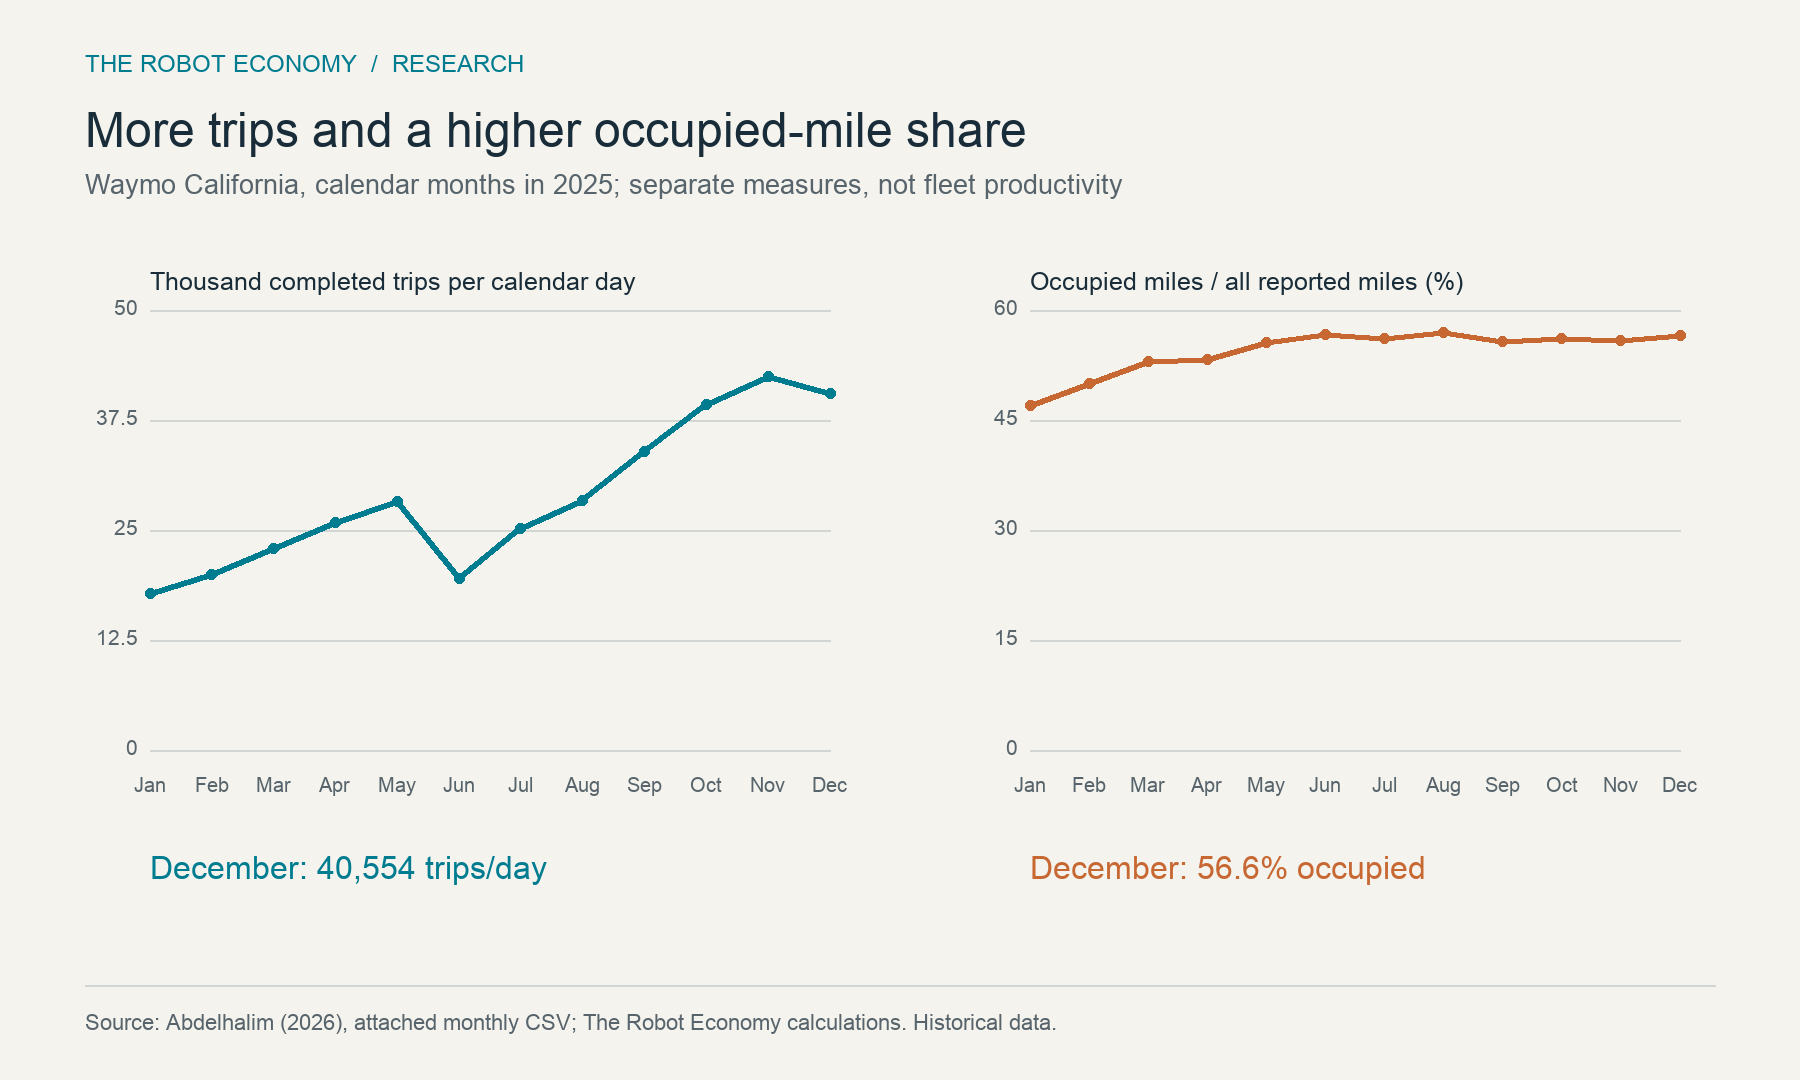
The mileage fields also allow a separate efficiency calculation. Period 1 covers repositioning and waiting for requests; Period 2 covers travel to a confirmed pickup; Period 3 covers passenger pickup to drop-off. Here, empty miles mean Periods 1 plus 2. In December 2025, passenger-onboard miles represented 56.6% of their combined total. That leaves about 76.8 empty miles for every 100 occupied miles.[6,7]
A higher occupied-mile share can come partly from longer passenger journeys. Between December 2024 and December 2025, empty miles per completed trip fell from 3.12 to 2.91, or 6.8%, while occupied miles per trip rose from 3.02 to 3.79, or 25.4%. The occupied share rose from 49.2% to 56.6%. These changes show less empty distance per trip and a different journey mix; they do not identify a change in trips per active car.[7]
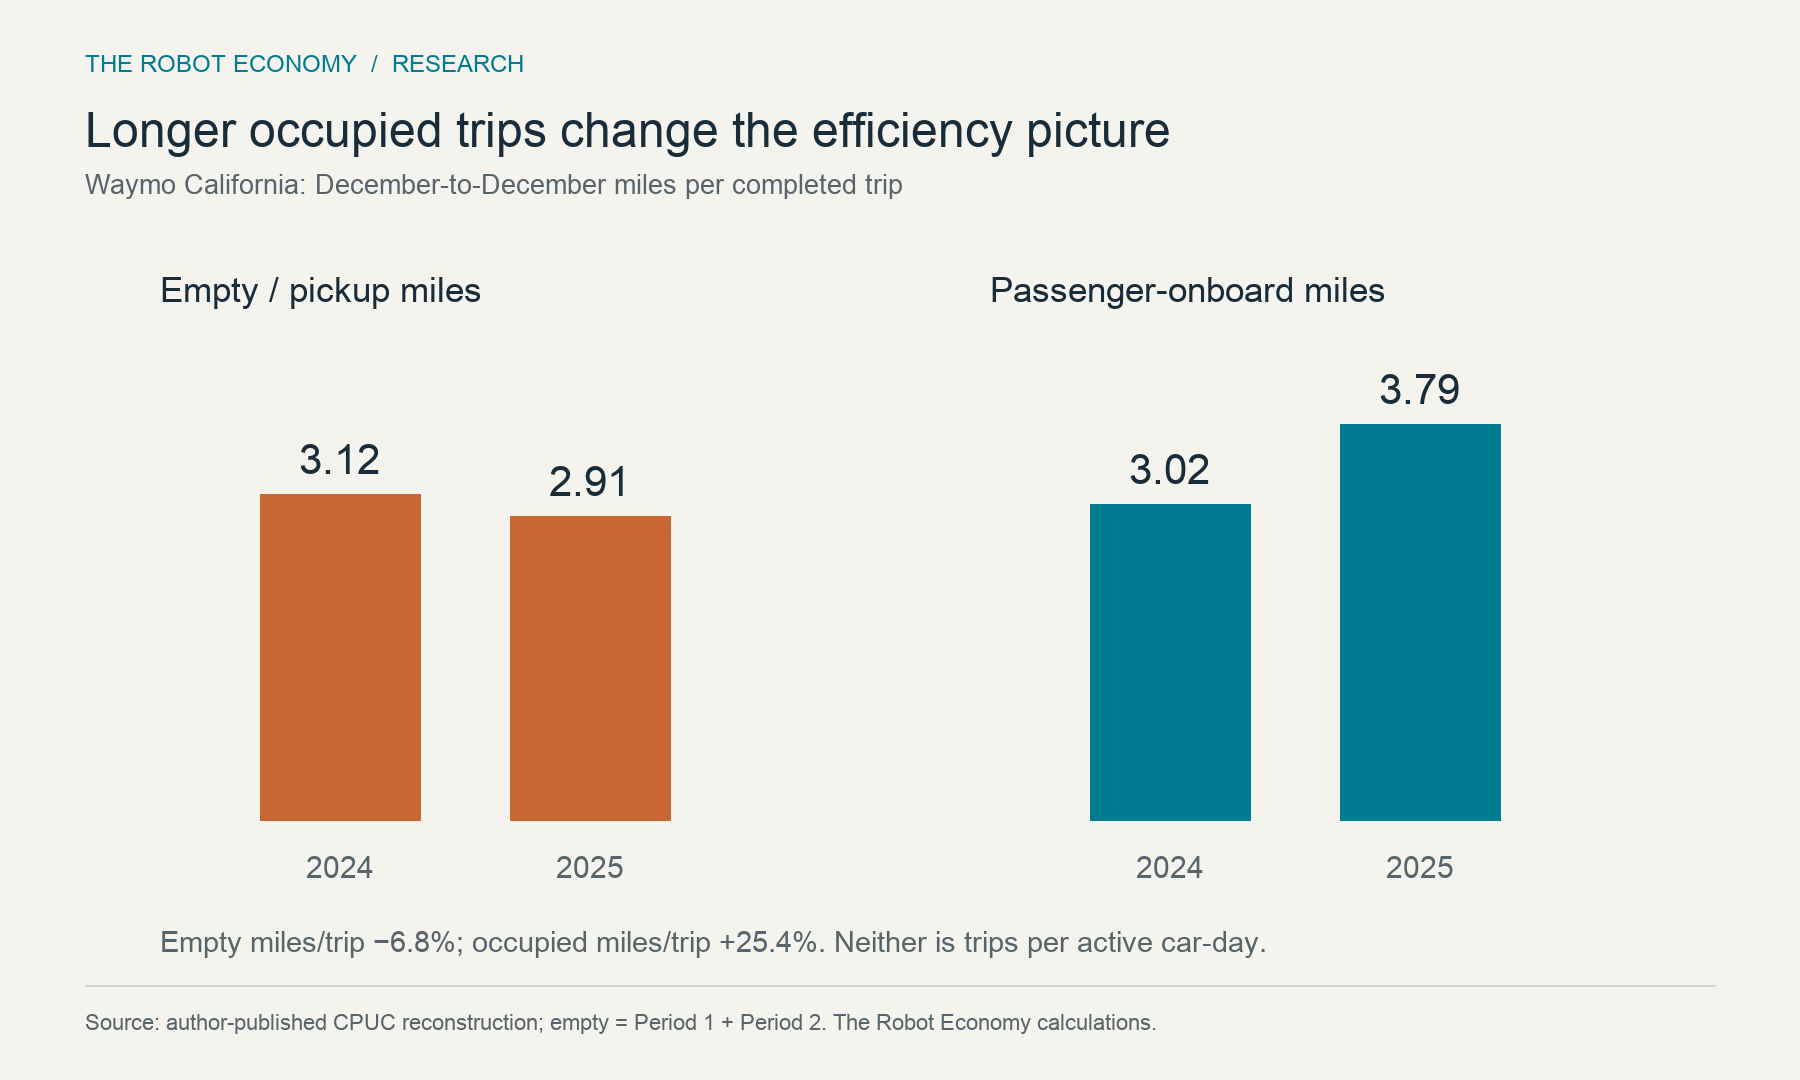
The source paper describes roughly 2.8 empty miles per trip at the end of 2025. Its attached December row yields 2.91 when Periods 1 and 2 are summed and divided by completed trips; we use that reproducible value. This is a historical reconstruction, not an independently audited vehicle log. Statewide aggregation also prevents isolating dispatch improvements from changing geography or service mix.[6,7]
Chinese disclosures show why the metric matters
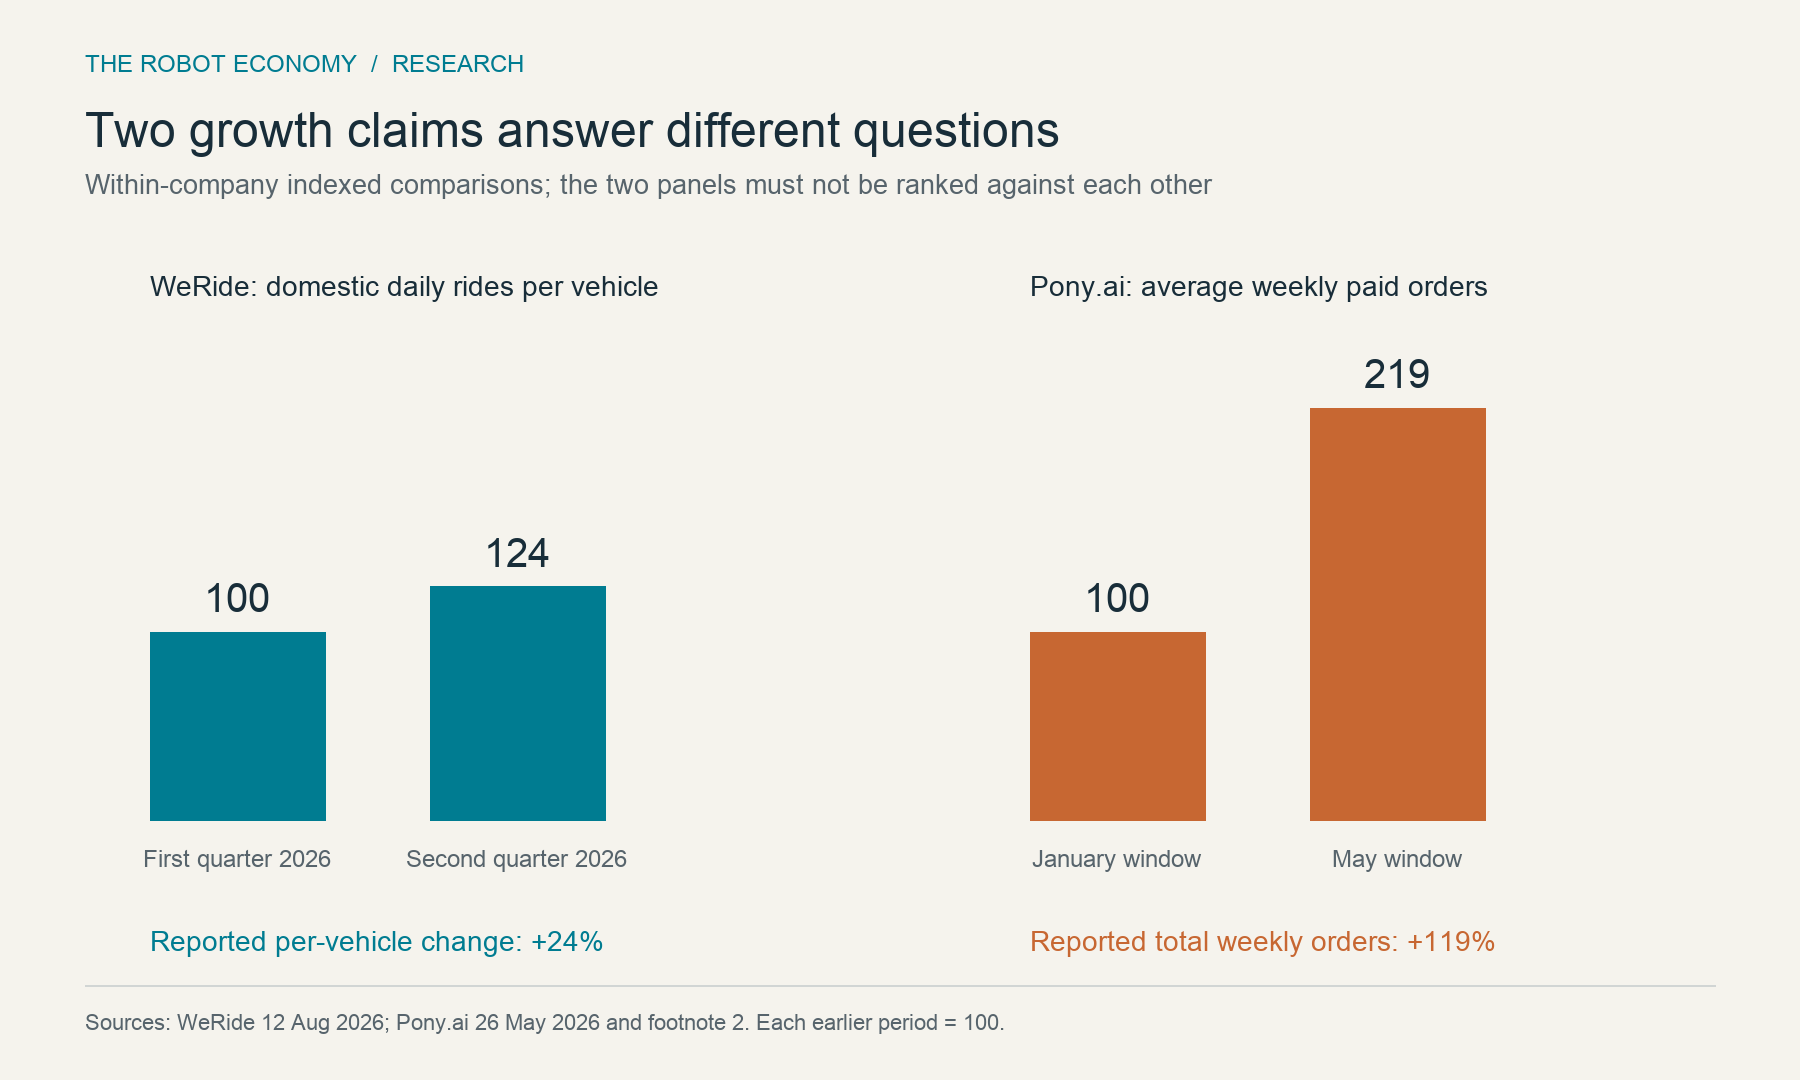
WeRide supplies a direct counterpoint to the idea that all growth must come from adding cars. It reports that domestic average daily rides per vehicle rose 24% quarter over quarter to more than 21 in the second quarter of 2026. On a first-quarter index of 100, the reported metric reaches 124. This is evidence of a reported per-vehicle improvement, conditional on a consistent definition; it is not an independently reconstructed active-vehicle-hour result.[3]
The disclosure does not provide enough underlying vehicle-time detail to reproduce that metric. Its global count of more than 1,800 robotaxis is dated 31 July, after the quarter, and includes overseas vehicles. Using that snapshot to scale the domestic quarterly metric would mix geography, timing and eligibility. The stated peak of 28 daily rides per vehicle is also a peak, not the average.[3]
Pony.ai reports a different measure: average weekly paid orders rose 119% between its January and May 2026 windows. Footnote 2 defines May as 27 April–24 May, four weeks, and January as 29 December–1 February, five weeks. Those are weekly averages, not monthly totals. The earlier-window index is 100 and the later one 219; no matched active vehicle-time series accompanies that comparison.[4]
Pony.ai’s accompanying count of 1,776 vehicles as of 24 May is explicitly vehicles produced in footnote 4. Its subsequent 1,975-vehicle fleet figure is dated 30 June. Neither provides the active denominator for the two order windows. Its second-quarter revenue discussion also includes joint-deployment contributions, so robotaxi-services revenue cannot simply be substituted for passenger fares or trip volume.[4,5]
Keep international footprints out of the utilization denominator
Baidu’s second-quarter release describes Apollo Go’s 28-city footprint and cumulative autonomous distance, including a separate fully driverless subset. It distinguishes commercial Dubai operations from testing in other markets. The inspected written release provides neither a matched active-fleet denominator nor a quarterly ride total. City counts and cumulative kilometres cannot fill that gap.[8]
Waymo’s undated sustainability page reports more than 500,000 fully autonomous electric-vehicle trips per week. It supplies no matching fleet denominator or measurement week for that threshold, and the wording is not a paid-trip series. It therefore cannot be combined with a differently dated global fleet estimate to compare daily utilization with WeRide’s domestic quarterly metric.[9,3]
What operators and buyers should ask for
Keep three scorecards. Service scale needs completed trips, market coverage and paid-service status. Fleet productivity needs matched available vehicle-hours, completed trips per hour and cohort mix. Mileage efficiency needs occupied, pickup and repositioning miles with identical boundaries. For charging and depot planning, total miles and idle or charging time matter alongside trip counts. A gain on one scorecard does not settle the other two.[2,3,7]
The economic bridge needs another layer: retained fare revenue per completed trip, the full distance and time required to serve it, and the associated operating and capital costs. Longer trips may raise occupied mileage while lowering trips per hour. Lower empty-mile share may help distance-related costs while leaving remote support, cleaning, maintenance or capital recovery unresolved. No profitability or congestion reduction is inferred here.[5,7]
Method, limitations and the next test
We compared opened operator releases and the regulator’s current reporting page, then recomputed the historical California panel from the published CSV. Counts with commas were parsed numerically; total miles are the sum of the three period fields. Per-trip ratios use completed trips; calendar-day volume uses actual month lengths. We excluded the three pre-commercial rows, made no missing-month interpolation and kept operator indices and explicit scenarios separate from the California series.[2,3,4,5,6,7,8,9]
The derived monthly data appendix permits reproduction of the charts and December comparisons; the original attachment remains linked. Its period ends in December 2025 and should not be read as current 2026 utilization. The latest regulator archives were not extracted in this review. Company-reported operating definitions may differ or change. No same-market matched active-fleet series, controlled deployment experiment or standardized international denominator was established.[2,7,3]
Two tests would materially change the assessment. First, inspect the next California reporting cycle after the 1 November submission deadline: if public files provide usable vehicle-time alongside trips, reconstruct same-scope productivity rather than treating the access gap as permanent. Second, require any claimed per-vehicle improvement to persist across two consecutive comparable quarters with disclosed eligibility, service hours and city cohorts. A flat or falling same-cohort rate would weaken a utilization-led growth claim.[2,3]
The evidence supports a precise answer: some per-vehicle improvement is reported, historical mileage efficiency can be calculated, and service volume has grown. The fraction of total robotaxi growth attributable to better use of the fleet remains unresolved without matched vehicle-time. The next useful disclosure is a denominator that lets readers separate those mechanisms.[2,3,4,7]