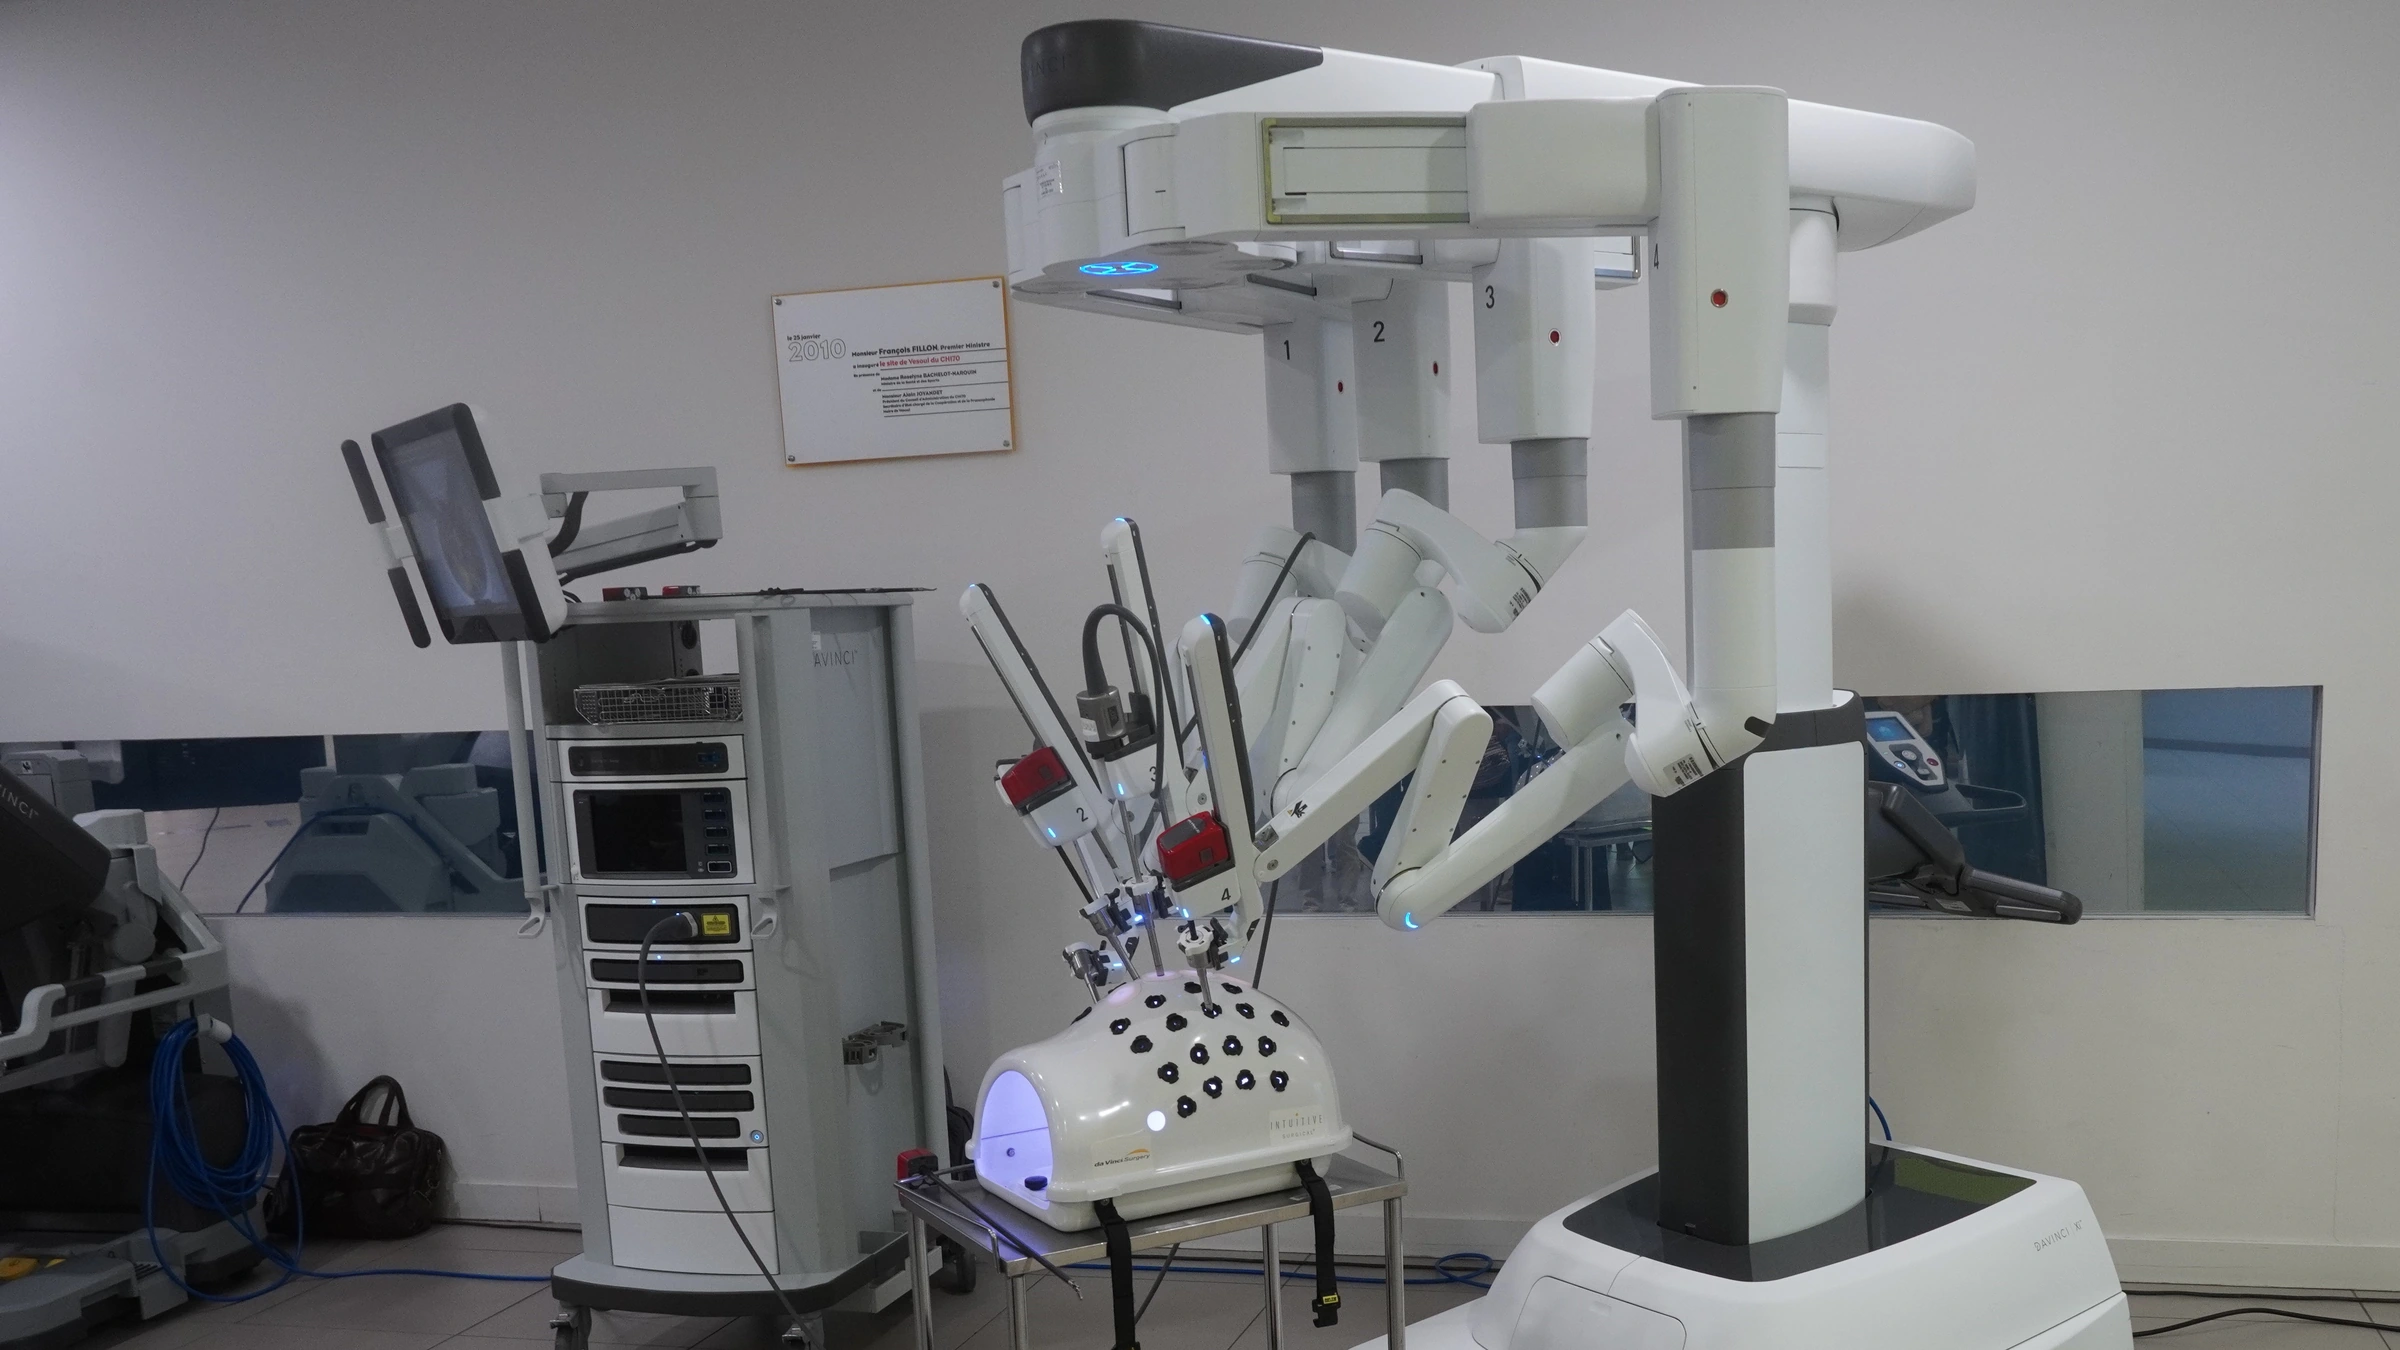
The installation count is only the start
A robot supplier can place more systems without proving how often they work, what customers earn from them, or how much repeat revenue the supplier receives. Intuitive’s 20 October results give enough detail to separate those questions. Historical MicroPort MedBot filings and Stryker’s new CMR Surgical alliance expose different reporting boundaries. The useful comparison is what each record proves, rather than a league table of incompatible businesses.[1,3,4,5]
First reconcile the stock and the flow
Intuitive placed 546 da Vinci systems in the quarter ended 30 September 2026. The installed base started at 11,710. Subtracting 162 combined trade-ins, lease upgrades and retirements produces the reported ending stock of 12,094: a net increase of 384. The 162 is not a count of failed systems or customer losses.[1,2]
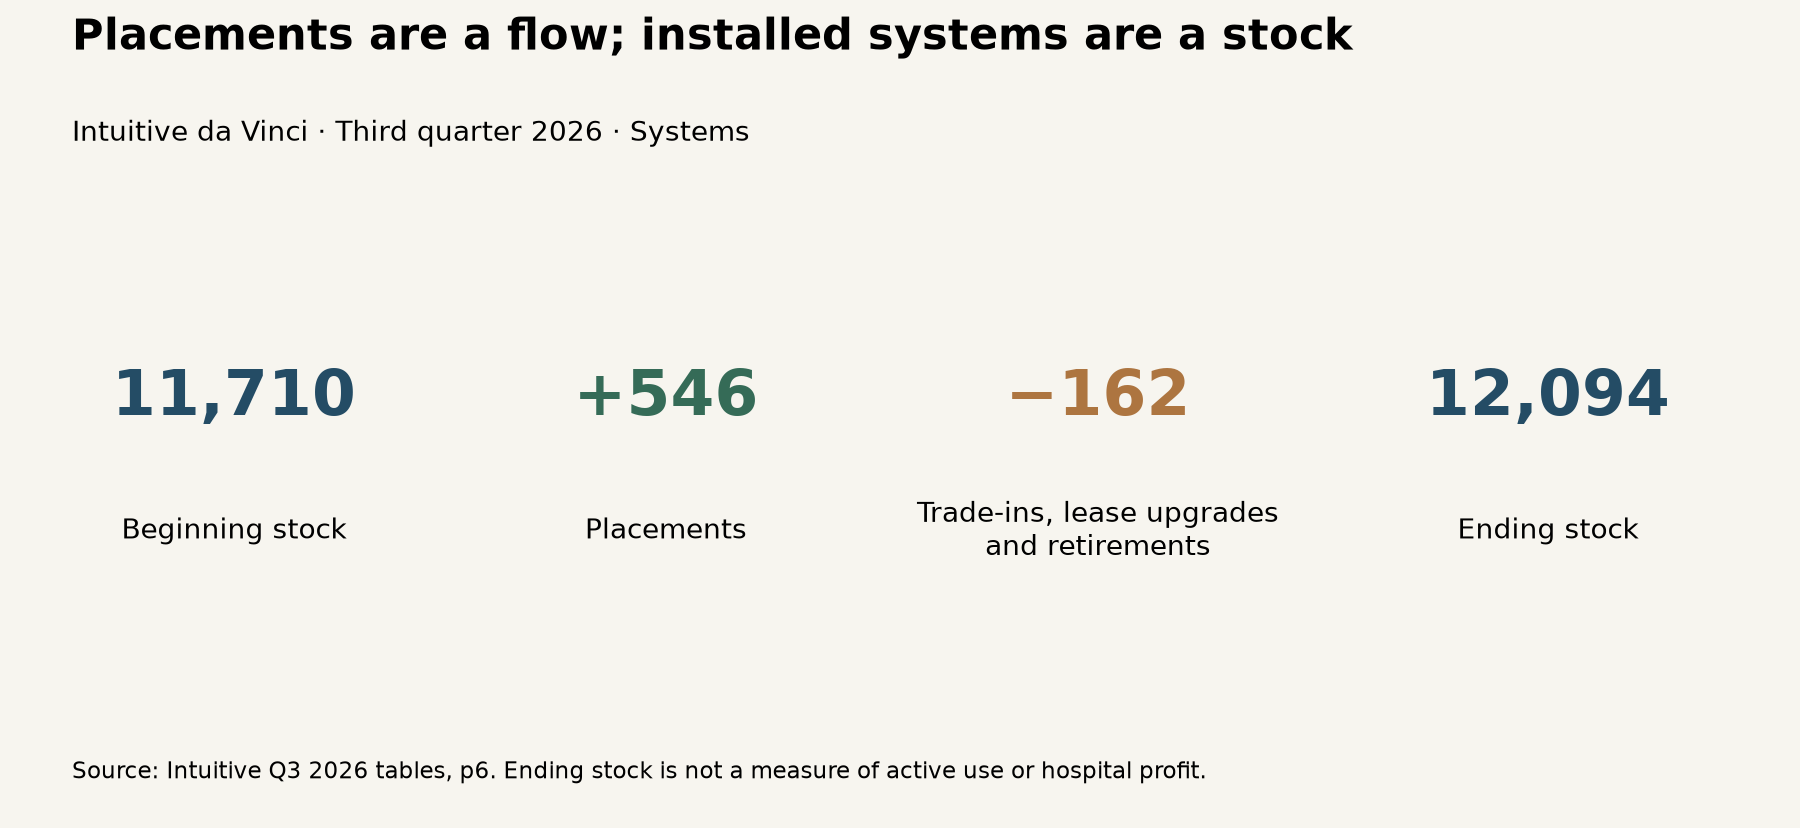
For fleet and service planning, request the stock reconciliation before using shipments as an expansion measure. Then ask for activity, site-level uptime and replacement history. This is a diligence framework, not evidence that the public installed-base estimate measures those operational outcomes.[2]
Then bridge the repeat revenue
Intuitive reports worldwide recurring revenue of $2,554.6 million, compared with $2,137.7 million a year earlier. The $416.9 million increase consists of $278.6 million from instruments and accessories, $86.3 million from services and $52.0 million from operating leases. Lease revenue is already included in the recurring total, even though its accounting classification is systems revenue. Adding it again overstates the result.[2]
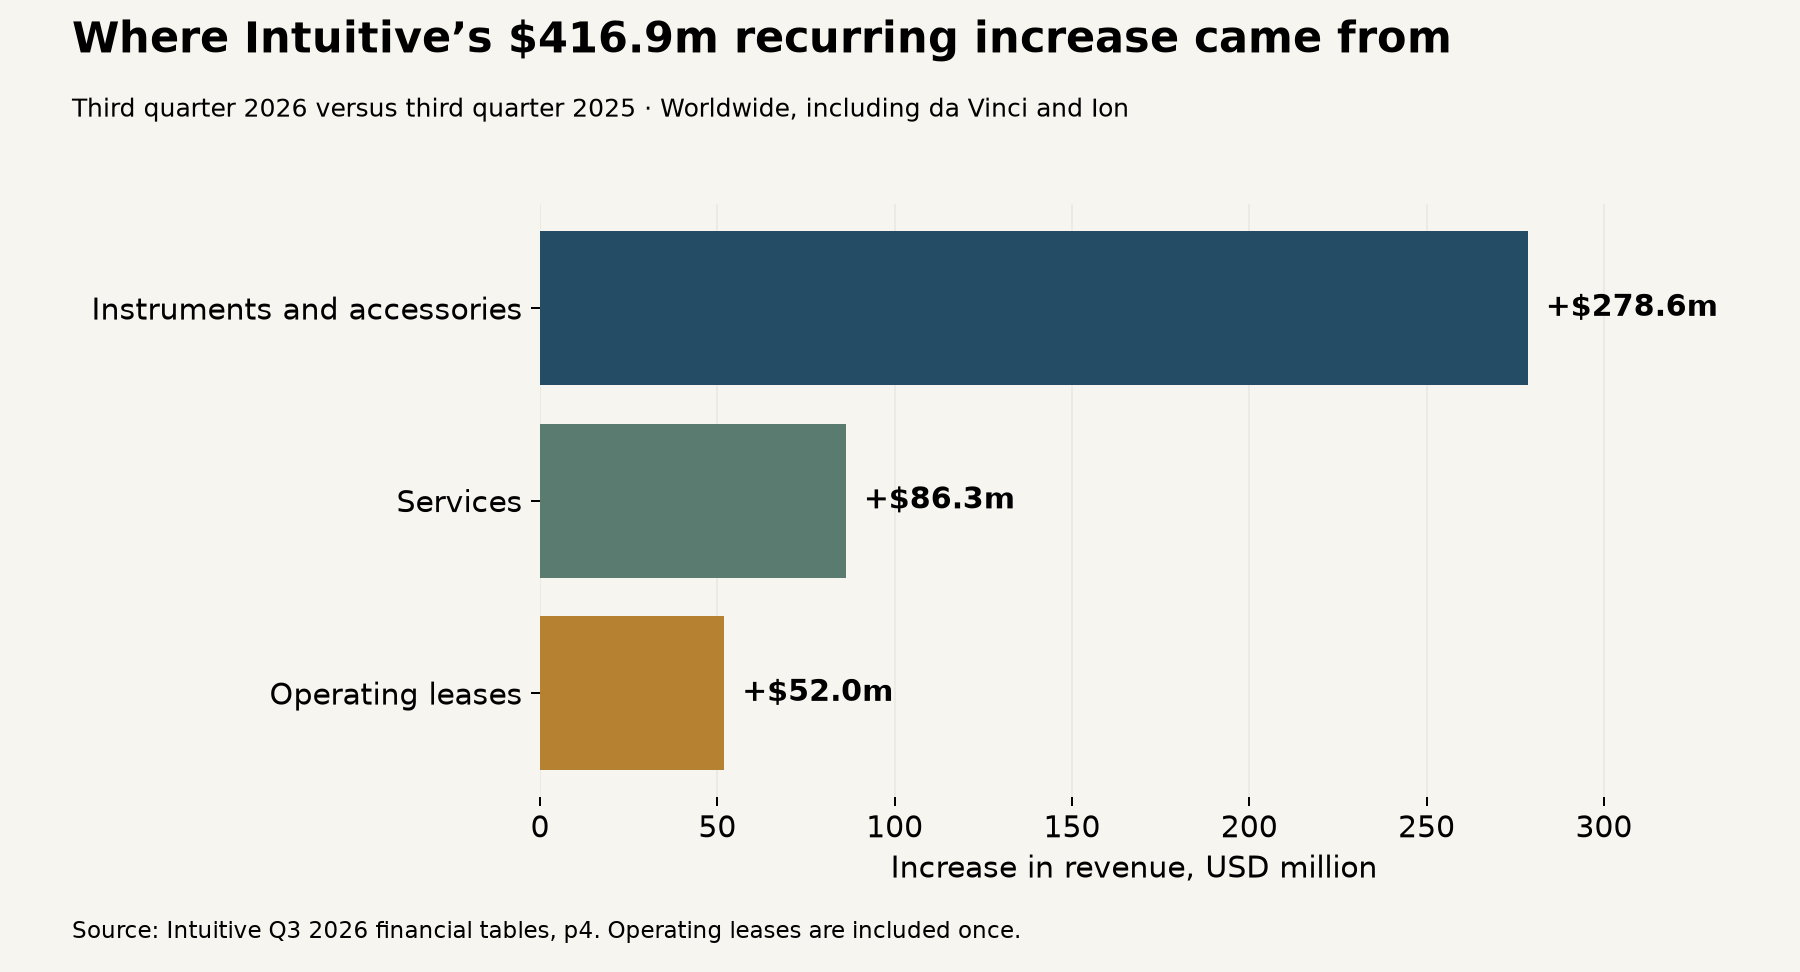
Recurring revenue represents 83.8% of total revenue in the new quarter. That describes an accounting mix, not a contracted subscription guarantee. Do not divide this consolidated numerator by da Vinci-only procedures to estimate revenue per operation: the scopes differ.[2]
Financing shifts who carries the utilization exposure
Of the 546 da Vinci placements, 291 used operating leases, including 160 with usage-based arrangements. The remaining 131 operating-lease placements had fixed payments. Usage-based placements therefore represent 29.3% of all placements, within a 53.3% operating-lease share. These are new-placement proportions, not the leasing mix of the installed fleet.[1,2]
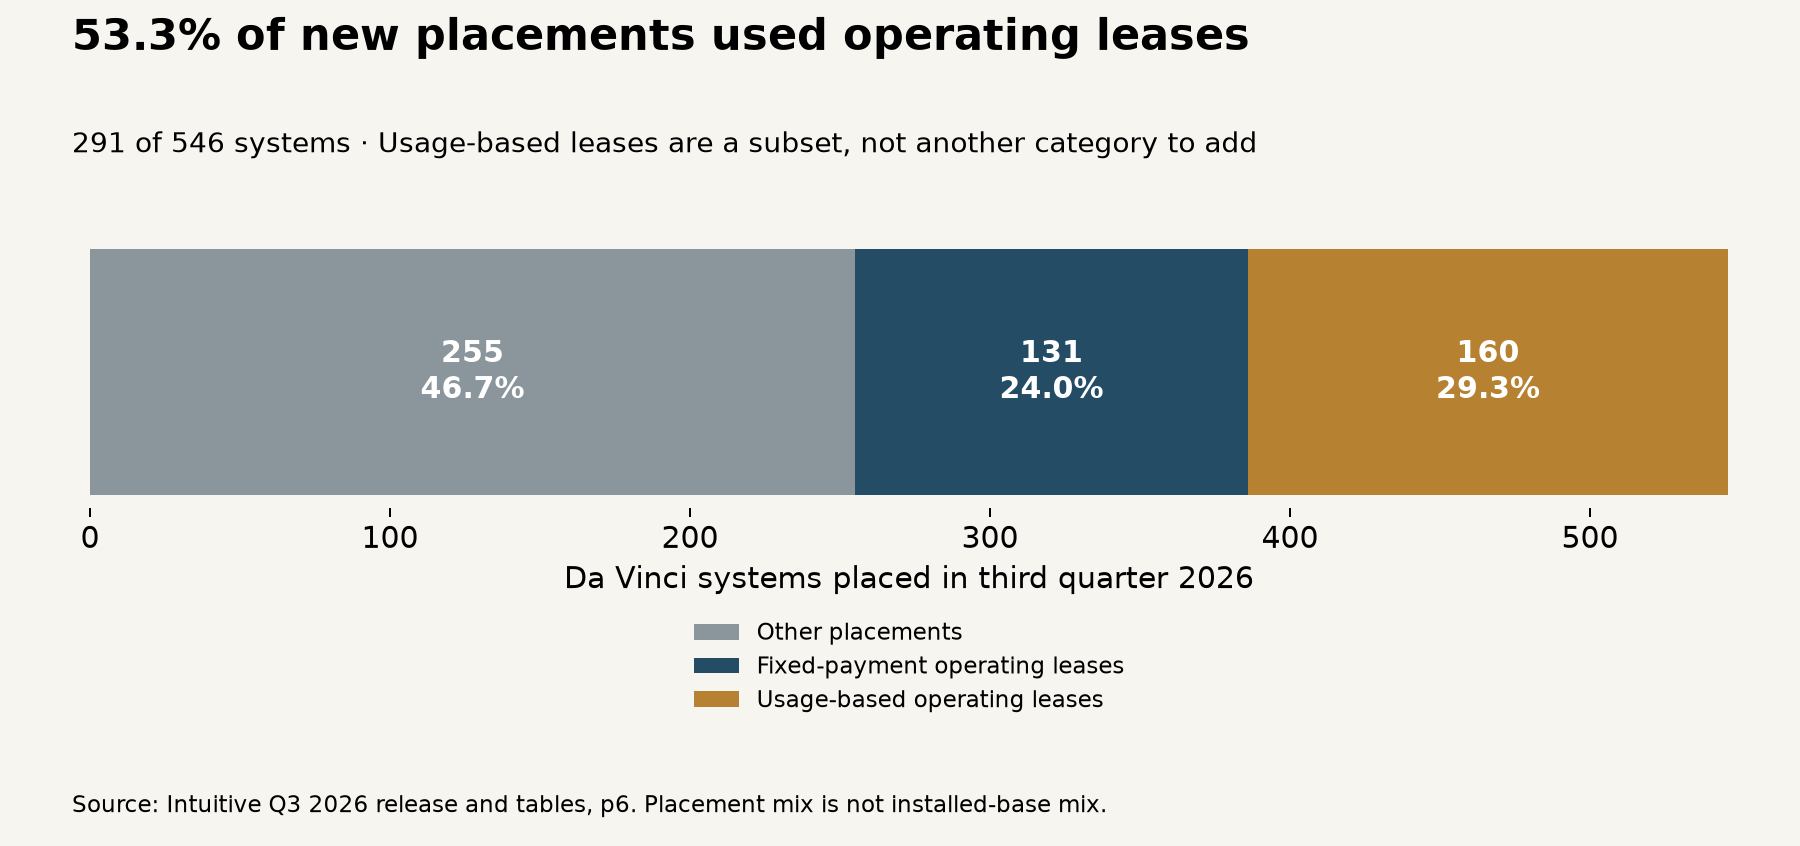
If usage expands, usage-based contracts can connect the supplier’s receipts more directly to activity. If capacity is underused, the same arrangement leaves a different exposure from a fixed payment. Neither scenario can establish a hospital’s return without its contract, staffing and procedure-cost data.[1,2]
The China panel: a different disclosure boundary
MicroPort MedBot’s 2025 annual report discloses 539.267 million renminbi in a combined surgical-systems, instruments and accessories line, against 252.410 million in 2024. Separately disclosed service income is 7.700 million renminbi, against 2.230 million. Total revenue is 551.069 million renminbi. Consumables and capital equipment are bundled, so service income cannot stand in for the company’s total recurring revenue.[3]
The earlier interim report uses a similar device/accessory boundary: first-half 2025 device and accessory sales were 172.679 million renminbi and services 3.010 million, within total revenue of 175.689 million. It also says there is no discrete operating-segment information. These historical records describe disclosure; they do not establish current-quarter demand or a comparable recurring share.[4]
The calculation that cannot be made is itself the purchasing boundary: a valid comparison needs separated consumable revenue, matched reporting periods and consistent lease definitions. Leave that comparison blank until those inputs exist. Currency conversion would not repair the missing category split.[3,4]
The UK–US panel: capital and distribution are earlier evidence
Stryker’s 12 October announcement describes an approximately $400 million preferred equity investment in CMR Surgical, an exclusive option for a future acquisition and an exclusive US sales agency for Versius. The proposed investment is subject to closing conditions. The announcement is evidence of a financing and commercial route, not a completed acquisition or realized recurring receipts.[5]
This matters because investment, distribution reach, installations and repeated use sit at different points in the commercial chain. A new route to customers may improve the opportunity to place systems. It cannot substitute for disclosed procedures, consumable purchases or service renewals. The three panels therefore remain separate.[1,3,5]
Method, limits and the next test
We selected five issuer primary records from three publisher families, using the 20 October earnings release as the fresh anchor. We recomputed three figure families from compatible Intuitive tables and checked the accounting definitions against two historical MedBot filings. The Stryker record tests whether a financing announcement supplies the same evidence. It does not. No exchange-rate normalization, clinical comparison, causal adoption estimate or independent audit is claimed. The downloadable CSV retains units, periods and locators.[1,2,3,4,5]
Two observations could change the interpretation. In Intuitive’s next two quarterly disclosures, check whether procedure growth remains positive and whether instruments, services and lease revenue continue to grow together. Separately, when MedBot next reports a standalone consumables and leasing split, rebuild a matched-period recurring panel; the present inability to compare would then narrow. For CMR, count realized activity only when a primary disclosure reports it. Missing public data is not evidence of zero activity.[1,2,3,4,5]
Cover context: the photograph shows a da Vinci Xi and demonstration equipment at a public open day in Vesoul, France, on 23 September 2023. It illustrates the installed-product category, not a 2026 event, a da Vinci 5 or a surgical outcome. Photograph by A.BourgeoisP via Wikimedia Commons, CC BY-SA 4.0; crop and resize, with the derivative photograph under the same license.[6]
